Other assets
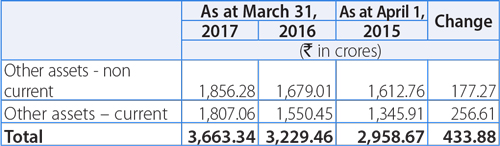
These mainly includes prepaid expenses, including rentals on operating lease of Rs. 233.09 crores as at March 31, 2017, as compared to Rs. 218.29 crores as at March 31, 2016. Taxes recoverable, statutory deposits and dues from government were Rs. 2,433.82 crores as at March 31, 2017, as compared to Rs. 2,185.49 crores as at March 31, 2016. Capital advances were Rs. 558.84 crores as at March 31, 2017, as compared to Rs. 453.47 crores as at March 31, 2016.
Equity was Rs. 20,809.15 crores and Rs. 23,262.11 crores as at March 31, 2017 and 2016, respectively, a decrease of 10.5%.
Other equity decreased by 10.9% from Rs. 22,582.93 crores as at March 31, 2016 to Rs. 20,129.93 crores as at March 31, 2017, mainly due to losses for Fiscal 2017.
Borrowings
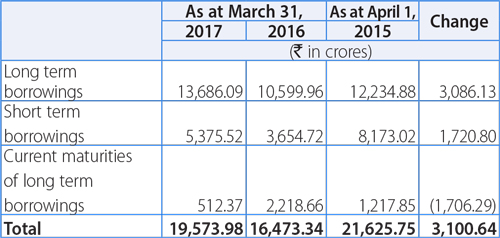
- Current maturities of long-term borrowings represent the amount of loan repayable within one year.
- During Fiscal 2017, the Company raised Rs. 2,700 crores through unsecured non-convertible debentures with a tenor ranging from 2 years to 5 years.
Other financial liabilities
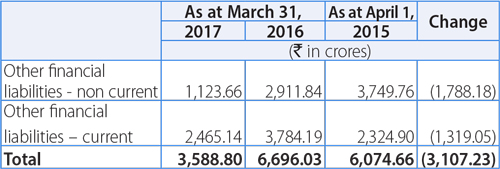
These included Rs. 2,045.08 crores of financial guarantee contracts as at March 31, 2017 compared to Rs. 3,391.29 crores as at March 31, 2016. The reduction is due to payments and reversal of provision in Fiscal 2017. Further, current maturities of long-term borrowings were Rs. 512.37 crores as at March 31, 2017 as compared to Rs. 2,218.66 crores as at March 31, 2016. Furthermore, interest accrued but not due on borrowings were Rs. 449.73 crores as at March 31, 2017 as compared to Rs. 453.41 crores as at March 31, 2016.
Trade payables were Rs. 7,015.21 crores as at March 31, 2017, as compared to Rs. 5,141.17 crores as at March 31, 2016, mainly due to sundry creditors for goods supplied and services received, liabilities for variable marketing expenses, wage revisions etc.
Acceptances were Rs. 4,379.29 crores as at March 31, 2017, as compared to Rs. 3,887.28 crores as at March 31, 2016.
Provisions (current and non-current) were made towards warranty and employee benefit schemes. Short-term provisions are those, which are expected to be settled during next financial year. The details are as follows:
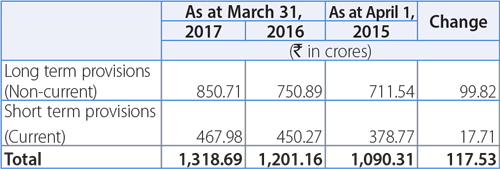
- Provision for warranty increased to Rs. 657.38 crores as at March 31, 2017, as compared to Rs. 597.85 crores as at March 31, 2016, a marginal increase of Rs. 59.53 crores.
- The provision for employee benefits obligations increased to Rs. 610.92 crores as at March 31, 2017, as compared to Rs. 575.53 crores as at March 31, 2016, mainly due to changes in actuarial assumptions.
Other liabilities
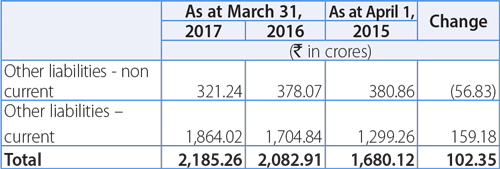
These mainly includes liability for advance received from customers of Rs. 849.51 crores as at March 31, 2017, as compared to Rs. 728.65 crores as at March 31, 2016. Deferred revenue were Rs. 428.05 crores as at March 31, 2017, as compared to Rs. 427.58 crores as at March 31, 2016. Statutory dues (VAT, Excise, Service Tax, Octroi etc.) were Rs. 799.04 crores as at March 31, 2017, as compared to Rs. 713.83 crores as at March 31, 2016.
Deferred tax liability represent timing differences where current benefit in tax will be offset by a debit in the statement of profit and loss. The amount increased to Rs. 97.95 crores as at March 31, 2017, as compared to Rs. 71.39 crores as at March 31, 2016.
Standalone Cash Flow
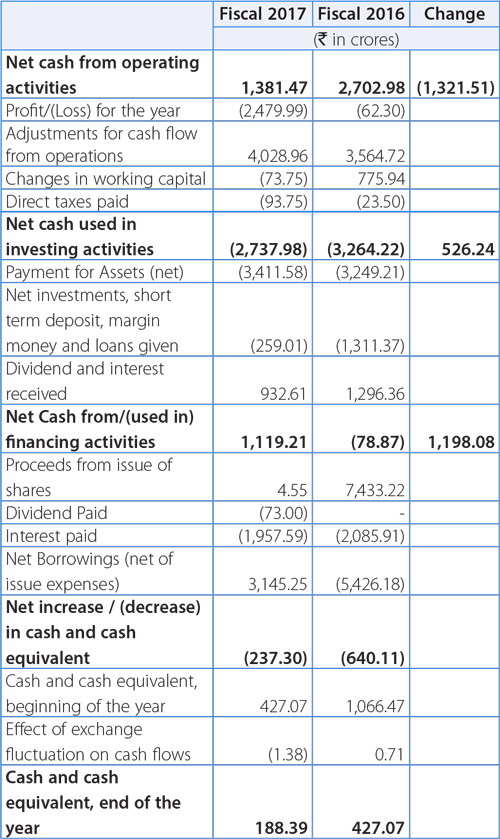
- Decrease in net cash from operations reflects loss in Fiscal 2017. The cash from operations before working capital changes was Rs. 1,548.97 crores in Fiscal 2017 compared to Rs. 3,502.42 crores in Fiscal 2016. There was net outflow of Rs. 73.75 crores in Fiscal 2017 towards working capital changes.
- The net cash used in investing activities was Rs. 2,737.98 crores in Fiscal 2017 compared to Rs. 3,264.22 crores in Fiscal 2016, mainly attributable to:
- Investments in mutual funds in Fiscal 2017 was Rs. 537.40 crores as compared to Rs. 1,669.02 crores in Fiscal 2016.
- The cash used for payments for fixed assets was Rs. 3,411.58 crores (net) in Fiscal 2016 compared to Rs. 3,249.21 crores in Fiscal 2016.
- Inflow by way of divestments in subsidiary companies resulting in cash inflow of Rs. 746.90 crores in Fiscal 2016.
- Inflow due to dividends and interest in Fiscal 2017 was Rs. 932.61 crores as compared to Rs. 1,296.36 crores in Fiscal 2016.
- There was an inflow (net) of Rs. 264.29 crores in Fiscal 2017 compared to an outflow of Rs. 227.49 crores for Fiscal 2016 towards Fixed / restricted deposits.
- There was an outflow (net) of Rs. 139.08 crores in Fiscal 2017 compared to inflow of Rs. 613.81 crores for Fiscal 2016 towards investments in subsidiary, joint arrangements and associate companies.
- The net change in financing activity was an inflow of Rs. 1,119.21 in Fiscal 2017 against outflow of Rs. 78.87 crores in Fiscal 2016. The outflow is attributable to:
- Long-term borrowings (net) – inflow of Rs. 1,474.30 crores in Fiscal 2017 as compared to outflow of Rs. 949.90 crores.
- Short-term borrowings (net) – inflow of Rs. 1,670.95 crores in Fiscal 2017 as compared to outflow of Rs. 4,476.28 crores.
- During Fiscal 2016, the Company raised Rs. 7,433.22 crores through rights issue of shares.
- In Fiscal 2017, the Company paid dividend of Rs. 73.00 crores.
- In Fiscal 2017, interest payment was Rs. 1,957.59 crores as compared to Rs. 2,085.91 crores in Fiscal 2016.
FINANCIAL PERFORMANCE OF JAGUAR LAND ROVER (AS PER IFRS)
The financial statements of Jaguar Land Rover are prepared in accordance with International Financial Reporting Standards (IFRS) applicable in the United Kingdom. This information is given to enable the readers to understand the performance of Jaguar Land Rover on a consolidated basis for the Jaguar Land Rover group.
Revenues for Jaguar Land Rover for Fiscal 2017 were GB£24,339 million, an increase of 9.2% compared to GB£22,286 million in Fiscal 2016, driven primarily by increased wholesale volumes and a more favourable foreign exchange environment with the weaker pound following Brexit.
Material and other cost of sales in Fiscal 2017 were GB£15,071 million were 12.4% higher compared to the GB£13,405 million in Fiscal 2016 (and increased as a proportion of revenue to 61.9% in Fiscal 2017 compared to 60.1% in Fiscal 2016) primarily driven by the increase in sales volumes and the weaker pound.
Employee costs increased by 7.3% to GB£2,490 million in Fiscal 2017 compared to GB£2,321 million in Fiscal 2016, primarily reflecting increased headcount in manufacturing (to support the increase in production volumes) and product development to support Jaguar Land Rover's plans to launch new models.
Other expenses (net of income) increased by 9.9% to GB£4,997 million in Fiscal 2017 compared to GB£4,546 million in Fiscal 2016 primarily reflecting higher costs related to freight and distribution, warranty, selling and fixed marketing expense and launch costs.
In Fiscal 2017 there was an accounting policy change to reclassify gains and losses on revenue and cost hedges from "Other Expense" to "Revenue" and "Material and Other Cost" respectively which the Company believe more appropriately reflects the intent of these hedges. This change is also reflected in the financial statements of the prior year.
Product development costs capitalized increased by 14.8% to GB£1,426 million in Fiscal 2017 compared to GB£1,242 million in Fiscal 2016 due primarily to expenditure on the development of future products and technologies.
EBITDA was GB£2,955 million (12.1% margin) in Fiscal 2017, down 6.1% compared to the EBITDA of GB£3,147 million (14.1% margin) in Fiscal 2016 due to the factors described above.
EBIT was GB£1,458 million (6.0% margin) in Fiscal 2017, down 18.7% compared to the EBIT of GB£1,793 million (8.0% margin) in Fiscal 2016 due to the lower EBITDA as well as an increase in depreciation and amortization, partially offset by higher profits from company's China joint venture.
Profit before tax ("PBT") increased by 3.4% to GB£1,610 million in Fiscal 2017 compared to GB£1,557 million in Fiscal 2016, reflecting the lower EBIT and more unfavourable revaluation of unrealized foreign currency debt and hedges, offset by lower net finance expense, favourable revaluation of commodity hedges and GB£151 million of further insurance and other recoveries related to Tianjin (compared to the GB£157 million net charge incurred in Fiscal 2016).
Profit after tax ("PAT") decreased by 3.0% to GB£1,272 million in Fiscal 2017 compared to GB£1,312 million in Fiscal 2016. However, the effective tax rate of 21.0% in Fiscal 2017 was higher than the 15.7% in Fiscal 2016 primarily reflecting the non-recurrence of favourable deferred tax credits in Fiscal 2016 (£74 million related to UK Patent Box legislation).
Net cash generated from operating activities was GB£3,160 million in Fiscal 2017 compared to GB£3,556 million in Fiscal 2017 driven by solid profitability, positive working capital and noncash accruals of GB£467 million (positive working capital and non-cash accruals of GB£547 million in Fiscal 2016) and a GB£68 million dividend received from the China joint venture partially offset by GB£199 million of tax paid. After GB£3,070 million of total investment spending (excluding GB£368 million of research & development already expensed through the income statement) and GB£110 million of other income (primarily interest received and foreign exchange gains on deposits) free cash flow before financing was GB£295 million. Increases in debt of GB£841 million primarily reflects the approx. GB£857 million of bonds issued in January 2017 and a GB£45 million increase in the utilization of the invoice discounting facility offset by the redemption of the remaining US$84 million (GB£57 million) 8.125% notes due 2021 and lease payments of GB£4 million. Finance expenses and fees, primarily relating to interest payments on outstanding bonds and fees relating to financing facilities were GB£150 million and a dividend of GB£150 million was also paid to Tata Motors in June 2016. As at March 31, 2017, Jaguar Land Rover had a total cash balance of GB£5,487 million (comprised of GB£2,878 million of cash and cash equivalents and GB£2,609 million of financial deposits) compared to GB£4,651 million of total cash at March 31, 2016 (which comprised of GB£3,399 million of cash and cash equivalents and GB£1,252 million of financial deposits). With total cash of GB£5,487 million and an undrawn revolving credit facility of GB£1,870 million, total liquidity available to Jaguar Land Rover was GB£7,357 million at March 31, 2017, compared to GB£6,521 million at March 31, 2016.