Some of the Company’s financing agreements and debt arrangements set limits on and/or require prior lender consent for, among other things, undertaking new projects, issuing new securities, changes in management, mergers, sales of undertakings and investment in subsidiaries. In addition, certain negative covenants may limit the Company’s ability to borrow additional funds or to incur additional liens, and/or provide for increased costs in case of breach. Certain of the Company’s financing arrangements also include financial covenants to maintain certain debt- to-equity ratios, debt-to-earnings ratios, liquidity ratios, capital expenditure ratios and debt coverage ratios.
The Company monitors compliance with its financial covenants on an ongoing basis. The Company also reviews its refinancing strategy and continues to plan for deployment of long-term funds to address any potential non-compliance.
As at March 31, 2019, GB£262 million of cash was held by Jaguar Land Rover subsidiaries outside of the UK. The cash in some of these jurisdictions is subject to certain restrictions on cash pooling, intercompany loan arrangements or interim dividends. However, annual dividends are generally permitted and JLR do not believe that these restrictions have, or are expected to have, any impact on Jaguar Land Rover’s ability to meet its cash obligations.
Certain debt issued by Jaguar Land Rover is subject to customary covenants and events of default, which include, among other things, restrictions or limitations on the amount of cash, which may be transferred outside the Jaguar Land Rover group of companies in the form of dividends, loans or investments to the Company and its subsidiaries. These are referred to as restricted payments in the relevant Jaguar Land Rover financing documentation. In general, the amount of cash which may be transferred as restricted payments from the Jaguar Land Rover group to the Company and its subsidiaries is limited to 50% of its cumulative consolidated net income (as defined in the relevant financing documentation) from January 2011. As at March 31, 2019, the estimated amount that is available for dividend payments, other distributions and restricted payments was approximately GB£4,315 million.
FINANCIAL PERFORMANCE ON A STANDALONE BASIS
The financial information discussed in this section is derived from the Company’s Audited Standalone Financial Statements. These include the Company’s proportionate share of income and expenditure in its two Joint Operations, namely Tata Cummins Pvt Ltd and Fiat India Automobiles Pvt Ltd.
FY 2018-19 has been a good year for the Company, followed a period of high demand in the automotive sector in India.
Income from operations of the Company for FY 2018-19, stood at Rs.69,202.76 crores as compared to Rs.58,689.81 crores, an increase of 17.9%. Sale of vehicles stood at Rs.61,357.95 crores as compared to Rs.52,636.85 crores, an increase of 16.6%. Total number of vehicles sold were 732,428 units in FY 2018-19, as compared to 636,968 units in FY 2017-18, a growth of 15%. Sale of spare parts & miscellaneous products stood at Rs.6,965.74 crores as compared to Rs.5,231.19 crores, an increase of 33.2%.
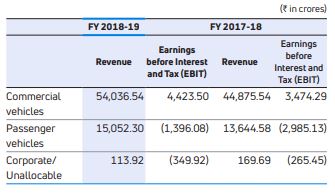
FY 2018-19, was the first full year of benefits of the strategic Organization Effectiveness (OE) program, designed to overhaul and transform the organizational structure of the company. As a result of the OE program, the company has drawn separate strategies for commercial vehicles and passenger vehicles from FY 2018-19.
Consequent to these changes, from April 1, 2018, the operating segments of the Company are as follows as at March 31, 2019 and 2018:
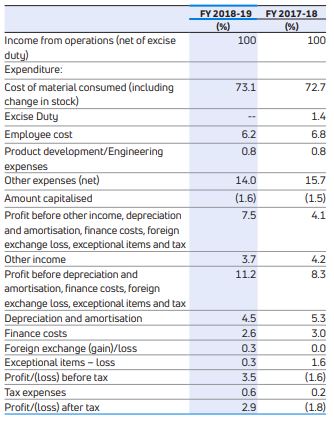
Cost of materials consumed (including change in stock)
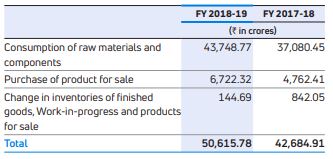
Cost of material consumed increased from 72.7% of total revenue to 73.1% in FY 2018-19, representing an increase of 40 bps, mainly due to product mix.
Excise duty Consequent to the introduction of Goods and Service Tax (GST) with effect from July 1, 2017, Central Excise, Value Added Tax (VAT) etc. have been replaced by GST. Excise duty for FY 2017-18 was Rs.793.28 crores.
Employee Costs were Rs.4,273.10 crores in FY 2018-19 as compared to Rs.3,966.73 crores in FY 2017-18, an increase by 7.7%, mainly due to higher volumes, annual increments, higher bonus and performance payment provisions for FY 2018-19 and wage revisions at some plant locations. The number of employees in TML Standalone only were 27,572 as at March 31, 2019, as compared to 24,922 as at March 31, 2018. The Company has given share based payments to certain employees, resulting in a charge of Rs.8.44 crores in FY 2018-19
Other Expenses includes all works operations, indirect manufacturing expenses, freight cost, fixed marketing costs and other administrative costs. These expenses have increased by 4.8% to Rs.9,680.46 crores in FY 2018-19 from Rs.9,234.27 crores in FY 2017-18. The breakdown is provided below:
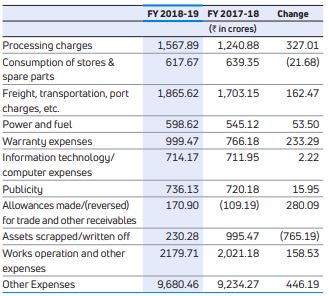
The changes are mainly driven by volumes and the size of operations.
- Freight, transportation, port charges etc., as a percentage to total revenue, were 2.7% in FY 2018-19, as compared to 2.9% in FY 2017-18. The increase in absolute amount is due to higher vehicle sales in FY 2018-19.
- Publicity expenses represented 1.1% of total revenues in FY 2018-19 and 1.2% in FY 2017-18. In addition to routine product and brand campaigns, the Company incurred expenses relating to new product introduction campaigns for the Harrier etc.
- Warranty expenses represented 1.4% and 1.3%, of the Company’s revenues in FY 2018-19 and 2018, respectively. The increase was due to increased volumes of M&HCV. Further, the Company has increased product warranty period for certain vehicles from four years to six years effective from January 1, 2018.
- Information technology/computer expenses represented 1% and 1.2% of the Company’s revenues in FY 2018-19 and 2018, respectively.
- Allowances made for trade and other receivables of Rs.170.90 crores in FY 2018-19, In FY 2018, there was a reversal due to favorable litigation orders.
- Assets written off of Rs.230.28 crores in FY 2018-19, as compared to Rs.995.47 crores in FY 2017-18
- Works operation and other expenses have decreased to 3.1% of net revenue in FY 2018-19 from 3.4% in FY 2017-18. The Company has run certain impact projects thereby reducing its fixed costs. In absolute terms the expenses increased by Rs.158.53 crores in FY 2018-19. The Company has subscribed to the Tata Brand Equity & Brand Promotion Agreement, for which the Company has to pay an annual subscription of 0.25% of the annual net income, subject to a ceiling of 5% of the annual profit before tax. In view of profits in FY 2018-19, there is an accrual for such fees.