ECONOMY OVERVIEW
INDIA
The Indian economy started the FY 2018-19 with a healthy 8.2% growth in the first quarter on the back of domestic resilience. Growth eased to 7.3% in the subsequent quarter due to rising global volatility, largely from financial volatility, normalized monetary policy in advanced economies, externalities from trade disputes, and investment rerouting. Further, the Indian rupee suffered because of the crude price shock, and conditions exacerbated as recovery in some advanced economies caused faster investment outflows.
Real GDP growth of India is 7.2% in FY 2018-19 compared to 6.7% in FY 2017-18. However, Q3 of FY 2018-19 saw a growth of 6.6%, slowest in five quarters. With the Indian economy projected to slow further in the fourth quarter, the Reserve Bank of India focus shifted from inflationary concerns to sustaining the growth momentum. Data released by the Society of Indian Automobile manufacturers signaled a slowdown in urban demand as car sales grew 2.7% in FY 2018-19, signaling near term softness due to some liquidity stress and slowing rural growth. Despite these challenges, the Indian economy remains one of the fastest growing and possibly the least affected by global turmoil supported in part by India’s strong macroeconomic fundamentals and policy changes (including amendments to the policy/code related to insolvency and bankruptcy, bank recapitalization, and foreign direct investment).
Currently, India is the fastest-growing trillion-dollar economy in the world and is expected to reach US$ 6 trillion by Fiscal 2027 and achieve upper-middle income status on the back of digitization, globalization, favourable demographics, and reforms. India is expected to be third largest consumer economy as its consumption is expected to triple to US$4 trillion by 2025. The World Bank expects, India’s GDP growth to accelerate moderately to 7.5% in Fiscal 2020, driven by continued investment, improved export performance, and resilient consumption. India is likely to become the world’s secondlargest economy by 2030, next only to China.
WORLD
Global growth is moderating as the recovery in trade and manufacturing activity is losing its steam. Despite ongoing negotiations, trade tensions among major economies remain elevated. A strengthening U.S dollar, heightened financial market volatility, and rising risk premiums have intensified capital outflow and currency pressures in some large Emerging Market and Developing Economies (EMDEs), with some vulnerable countries experiencing substantial financial stress. Growth in the United States has remained solid, bolstered by fiscal stimulus. In contrast, activity in the Euro Area has been somewhat weaker than previously expected, owing to slowing net exports. While growth in advanced economies is estimated to have slightly decelerated to 2.2% last year, it is still above potential and in line with previous forecasts. U.S. growth in 2018 has picked up to 2.9%, up 0.2% point from previous projections, mostly reflecting stronger-thanexpected domestic demand.
During 2018, commodities continued to remain volatile and have rebounded in the first quarter of 2019 due to rising trade tensions and geo-political risks. Having fallen or having remained subdued in the last quarter of 2018, most non-energy prices had recovered their losses by first quarter of 2019, with particularly strong rebounds in metal and minerals. This recovery in metal prices reflected improving growth prospects for China, which accounts for half of the global consumption, as well as a series of supply bottlenecks and concerns: the Vale dam accident in Brasil (iron ore, nickel); heavy floods in Chile (copper); smelter restrictions in response to environmental concerns in China (lead zinc); and export restrictions in Indonesia (tin)
The Euro Area growth slowed notably in 2018 to an estimated 1.9%. In particular, exports have softened, reflecting the appreciation of the Euro and slowing external demand. While unemployment has declined, inflation remains stubbornly low. Core inflation remained at around 1%, while long-term inflation expectations continue to hover around 1.6%, as in the past three years
China registered a growth of 6.5% in 2018. A rebound in private fixed investment helped offset a decline in public infrastructure and other state spending. However, industrial production and export growth have decelerated, reflecting easing global manufacturing activity. Import growth continued to outpace export growth, contributing to a shrinking current account surplus. Net capital outflows have resumed, and international reserves have been edging down. Stock prices and the RMB have experienced continued downward pressures, and sovereign bond spreads have risen amid ongoing trade tensions and concerns about the growth outlook. New regulations on commercial bank exposures to shadow financing, together with stricter provisions for off-budget borrowing by local governments, have slowed credit growth to the non-financial sector. However, in mid and late 2018, the authorities reiterated their intention to pursue looser macroeconomic policies to counter the potential economic impact of trade disputes with the United States. Prices of newly constructed residential buildings have rebounded, including in Tier 1 cities, following several years of correction. Consumer price inflation has generally moved up since mid-2018, partly reflecting currency depreciation and higher energy and food prices in most of last year, but it remains below target.
Japan’s economy also saw annualized growth of 0.8% due to bad weather and natural disasters. The labour market has been robust, with the unemployment rate at 2.4%, rising earnings, and the participation rate standing above 79%—up 1.5%, since the beginning of last year. Rising labour force inputs, however, have been offset by weak productivity. The Bank of Japan continues to provide stimulus by keeping long-term rates near zero and adding to its balance sheet. It now holds about 40% of government debt.
The GDP rate of Russia slowed down to 0.8% in 2018. At a growth rate of 1.2%, South Africa’s economic expansion would still be above the 0.8% level at which the economy expanded in 2018. The Middle East economy growth looks uncertain with the cut in oil production in compliance with OPEC+ deal and geopolitical risks will continue to cap the growth.
The global automobile industry is on the brink of major transformation. Technology is driving this shift, shaped by demographic, regulatory and environmental pressures. By 2025, the vehicle will grow smarter and more efficient, with high efficiency engines, lighter materials and autonomous driving systems. The industry will evolve, with new competition from tech companies, and suppliers capable of producing high-tech parts at low prices. The recent studies show that a dramatic shift of production and sales to the Asian markets will take place, and as a result, three lac jobs in Europe is expected to be at risk. Mobility ecosystems in major urban areas will lead to demotorization. Electric vehicles is expected to account for about 10% of new vehicle sales by 2025. Hybrids will reach a 40% share.
Global Commercial vehicle market is expected to reach $2.27 trillion by 2025. The market is projected to expand at a CAGR of 7.1% during the forecast period. Increased urbanization, coupled with rising spending on infrastructure development in emerging economies such as China, India, and Turkey, are expected to drive the market over the forecast period. In addition, increasing penetration of electric commercial vehicles is also anticipated to contribute toward market expansion over the coming years. Adoption of electric vehicles (EVs) is primarily driven by need to meet emission reduction standards and regulations enforced by government bodies worldwide. Commercial vehicle telematics is another trend that is gaining traction and is anticipated to have a positive impact on the market over the forecast period.
Global Car and Sports Utility Vehicles sales in 2019 is expected to fall slightly as the world economy stumbles. (Source : Global Economic Prospects, World Bank)
Automotive Operations
Automotive operations is the Company’s most significant segment, which include:
- activities relating to the development, design, manufacture, assembly and sale of vehicles as well as related spare parts and accessories;
- distribution and service of vehicles; and
- financing of the Company’s vehicles in certain markets.
The Company’s consolidated total sales (including international business sales and Jaguar Land Rover sales, excluding China joint venture) for FY 2018-19 and FY 2017-18 are set forth in the table below:
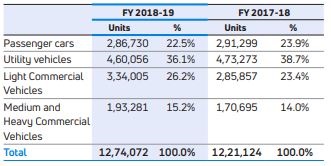
The Company sold 12,74,072 units and 12,21,124 units in FY 2018- 19 and FY 2017-18, respectively (excluding wholesales from the China joint venture), consisting of 7,61,786 units of Tata and other brand vehicles and 5,12,286 units of Jaguar Land Rover vehicles for FY 2018-19. In terms of units sold, the Company’s largest market is India, where the Company sold 6,93,756 units and 6,16,801 units during FY 2018-19 and FY 2017-18, respectively (constituting 54.5% and 50.5% of total sales in FY 2018-19 and FY 2017-18, respectively), followed by North America, where the Company sold 1,33,237 units and 1,36,447 units in FY 2018-19 and FY 2017- 18, respectively (constituting 10.5% and 11.2% of total sales in FY 2018-19 and FY 2017-18, respectively). The automotive operations segment is further divided into
- Tata and other brand vehicles - commercial vehicles;
- Tata and other brand vehicles – passenger vehicles;
- Jaguar Land Rover; and
- Vehicle Financing
Tata and other brand vehicles (including vehicle financing)
India is the primary market for Tata and other brand vehicles (including vehicle financing). During FY 2018-19, there was a robust and steady pace of economic growth in the geographic markets in which the Tata and other brand vehicles segment has operations.
The following table sets forth the Company consolidated total sales of Tata and other brand vehicles:
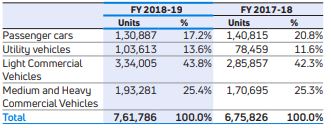
The Company’s overall sales of Tata and other brand vehicles increased by 12.7% to 7,61,786 units in FY 2018-19 from 6,75,826 units in FY 2017-18. Of the 7,61,786 units sold overall in FY 2018-19, the Company sold 6,93,756 units of Tata and other brand vehicles in India, while 68,030 units were sold outside of India, compared to 6,16,801 units and 59,025 units, respectively in FY 2017-18.
The above volumes includes Fiat branded vehicles of 23,237 in FY 2018-19, as compared to 29,807 in FY 2017-18.
Vehicle Sales in India
Automobile sales in India rose by 5.9% in FY 2018-19. The following table sets forth the Company‘s (on standalone basis) sales, industry sales and relative market share in vehicle sales in India. Passenger vehicles includes passenger cars and utility vehicles. Commercial vehicles include Medium & Heavy Commercial Vehicles and Light Commercial Vehicles.
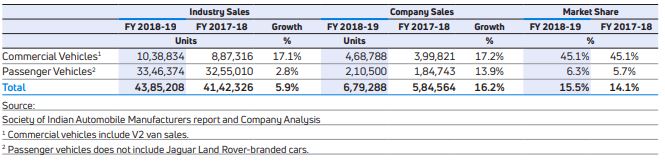
The Company's share of the Indian automotive vehicle market for commercial and passenger vehicles together increased from 14.1% in FY2017-18 to 15.5% in FY2018-19. Company maintained its leadership position in the commercial vehicle category in the industry, which was characterized by increased competition during the year. The passenger vehicle market also continued to be subject to intense competition. The commercial vehicle industry started on a very strong note which continues in the first half of FY2018-19. The increased axle load norms, liquidity crunch and other factors dampened the demand in the second half. The passenger vehicle industry performance was also affected by availability of retail finance, higher interest rates and insurance costs.
Passenger Vehicles in India
Industry-wide sales of passenger vehicles in India increased by 2.8% in FY 2018-19, compared to a 7.3% growth in FY 2017-18, Whilst market situation remained challenging throughout the year, the Company outperformed the industry with a growth of 13.9% for FY2018-19. The Company’s passenger vehicles category consists of: (i) passenger cars and (ii) utility vehicles.
The following table sets forth the Company’s passenger vehicle sales, industry sales and relative market share in passenger vehicle sales in India.
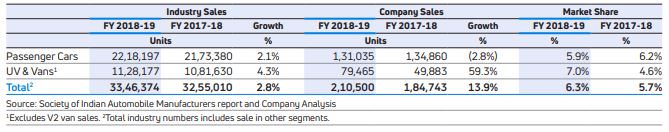
The Company sold 1,31,035 units in the passenger car category in FY 2018-19, representing a decrease of 2.8% compared to 1,34,860 units in FY 2017-18.
In the utility vehicles category, the Company sold 79,465 units in FY 2018-19, representing an increase of 59.3% from 49,883 units in FY 2017-18. Tata Nexon, which was launched in FY 2017-18 has helped the Company increasing its market share in UV segment to 7.0% in FY2018-19 as compared to 4.6% in FY2017-18. In January 2019, the Company launched, Harrier – SUV, the first model from Omega architecture and sold 4,363 units.