Other liabilities
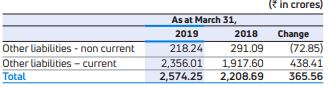
These mainly includes
- Contact liabilities were Rs.1,063.36 crores as at March 31, 2019, as compared to Rs.1,063.01 crores as at March 31, 2018.
- Government incentives increased to Rs.324.22 crores as at March 31, 2019 as compared to Rs.274.66 crores as at March 31, 2018.
- Statutory dues (GST, VAT, Excise, Service Tax, Octroi etc.) were Rs.1,091.92 crores as at March 31, 2019, as compared to Rs.781.12 crores as at March 31, 2018.
Deferred tax liability represent timing differences where current benefit in tax will be offset by a debit in the statement of profit and loss. The amount increased to Rs.205.86 crores as at March 31, 2019, as compared to Rs.154.61 crores as at March 31, 2018.
Standalone Cash Flow
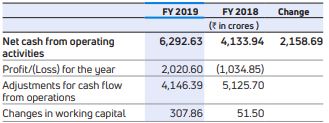
- Increase in cash from operations reflects better business performance in FY 2018-19. The cash from operations before working capital changes was Rs.6,167 crores in FY 2018-19 compared to Rs.4,090.85 crores in FY 2017-18. There was a net inflow of Rs.307.86 crores in FY 2018-19, as compared to Rs.51.50 crores in FY 2017-18 towards working capital changes.
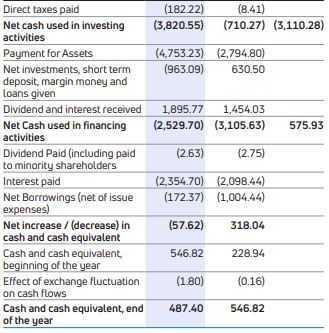
- The net cash used in investing activities was Rs.3,820.55 crores in FY 2018-19 compared to Rs.710.27 crores in FY 2017-18, mainly attributable to:
- The cash used for payments forfixed assets was Rs.4,753.23 crores (net) in FY 2018-19 compared to Rs.2,794.80 crores in FY 2017-18 due to higher BS6 investments.
- Outflow by way of investments in subsidiary companies resulting in cash outflows of Rs.837.98 crores in FY 2018- 19 as compared to Rs.300 crores in FY 2017-18.
- Outflow by way of deposits with financial institution resulting in cash outflow of Rs.500 crores in FY 2018-19 as compared to Rs.Nil in FY 2017-18.
- There was an outflow (net) of Rs.570.64 crores in FY 2018- 19 compared to Rs.110.96 crores for FY 2017-18 towards Fixed / restricted deposits.
- Increase in Investments in mutual funds in FY 2018-19 was Rs.413.74 crores as compared to increase of Rs.1,025.59 crores in FY 2017-18.
- Inflow due to dividends and interest in FY 2018-19 was Rs.1,895.77 crores as compared to Rs.1,454.03 crores in FY 2017-18.
- The net change in financing activity was an outflow of Rs.2,529.70 in FY 2018-19 against inflow of Rs.3,105.63 crores in FY 2017-18. The outflow is attributable to:
- Long-term borrowings (net) – outflow of Rs.703.98 crores in FY 2018-19 as compared to inflow of Rs.1,034.70 crores.
- Short-term borrowings (net) – inflow of Rs.531.61 crores in FY 2018-19 as compared to outflow of Rs.2,039.14 crores.
- In FY 2018-19, interest payment was Rs.2,354.70 crores as compared to Rs.2,098.44 crores in FY 2017-18.
- There has been positive Free cash flows of Rs.1,539.40 crores in FY 2018-19 due to improved performance mainly at Tata Motors Ltd.
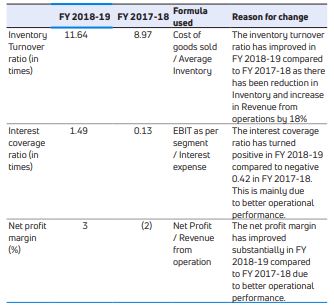
KEY FINANCIAL RATIOS
The details of significant changes (25% or more) in the key financial ratios in FY 2018-19 compared to 2018 is as follows:
FINANCIAL PERFORMANCE OF JAGUAR LAND ROVER (AS PER IFRS)
The financial statements of Jaguar Land Rover are prepared in accordance with International Financial Reporting Standards (IFRS) applicable in the United Kingdom. This information is given to enable the readers to understand the performance of Jaguar Land Rover [on a consolidated basis for the Jaguar Land Rover group.
Revenues for Jaguar Land Rover for FY 2018-19 were GB£24,214 million, a decrease of 6.1% compared to the GB£25,786 million in FY 2017-18, driven primarily by decreased wholesale volumes, primarily in China.
Material and other cost of sales in FY 2018-19 were of GB£15,670 million, down 4.0% compared to the GB£16,328 million in FY 2017- 18 (and increased as a proportion of revenue to 64.7% in FY 2018-19 compared to 63.3% in FY 2017-18) primarily driven by the decrease in sales volumes.
Employee costs increased by 3.6% to GB£2,820 million in FY 2018-19 compared to GB£2,722 million in FY 2017-18, primarily reflecting the higher average number of employees in FY 2018-19 compared to FY 2017-18.
Other expenses (net of income) decreased by 4.1% to GB£5,567 million in FY 2018-19 compared to GB£5,846 million in FY 2017-18.
Product development costs capitalized decreased by 2.1% to GB£1,576 million in FY 2018-19 compared to GB£1,610 million in FY 2017-18 primarily related to the development of future models, technologies and production facilities.