Investments (Current + Non-current) decreased to Rs.18,458.42 crores as at March 31, 2014 as compared to Rs.19,934.39 crores as at March 31, 2013.
- There was redemption of 6.25% Cumulative Redeemable Preference Shares of US$ 100 each at par of TML Holdings Pte Ltd, Singapore, of Rs.1,403.26crores and sale of Mutual funds of Rs.359.42 crores. The Company has also divested Equity shares of certain foreign subsidiary companies to TML Holdings Pte Ltd, Singapore of Rs.463.11 crores.
- This was partly offset by increase in investments in subsidiaries and associates of Rs.706.72 crores (Tata Motors Finance Ltd Rs.300 crores, Tata Motors European Technical Centre Plc Rs.13.07 crores, PT Tata Motors, Indonesia of Rs.53.65 crores, Fiat India Automobiles Ltd Rs.325 crores and Concorde Motors (India) Ltd. Rs.15 crores).
Inventories stood at Rs.3,862.53 crores as compared to Rs.4,455.03 crores as at March 31, 2013. Though the Company achieved reduction in inventory of Rs.592.50 crores, the total inventory has increased to 44 days of sales as compared to 37 days in last year.
Trade Receivables (net of allowance for doubtful debts) were Rs.1,216.70 crores as at March 31, 2014, as compared to Rs.1,818.04 crores as at March 31, 2013. The reduction reflects lower volumes and steps taken by the Company to control the credit. The receivable represented 16 days as at March 31, 2014, compared to 18 days as at March 31, 2013. However, the amount outstanding for more than six months (gross) has gone up to Rs.786.21 crores as at March 31, 2014 from Rs.682.82 crores as at March 31, 2013. These represented dues from Government owned transport companies and some of the dealers. The overdues are monitored and the Company has taken steps to recover these dues. However, based on the Company's assessment on non-recoverability of these overdues, these have been provided and accordingly the allowances for doubtful debts were Rs.511.36 crores as at March 31, 2014 against Rs.240.59 crores as at March 31, 2013.
Cash and bank balances were Rs.226.15 crores as at March 31, 2014 compared to Rs.462.86 crores as at March 31, 2013. The decrease was due to lower volumes.
Standalone Cash Flow
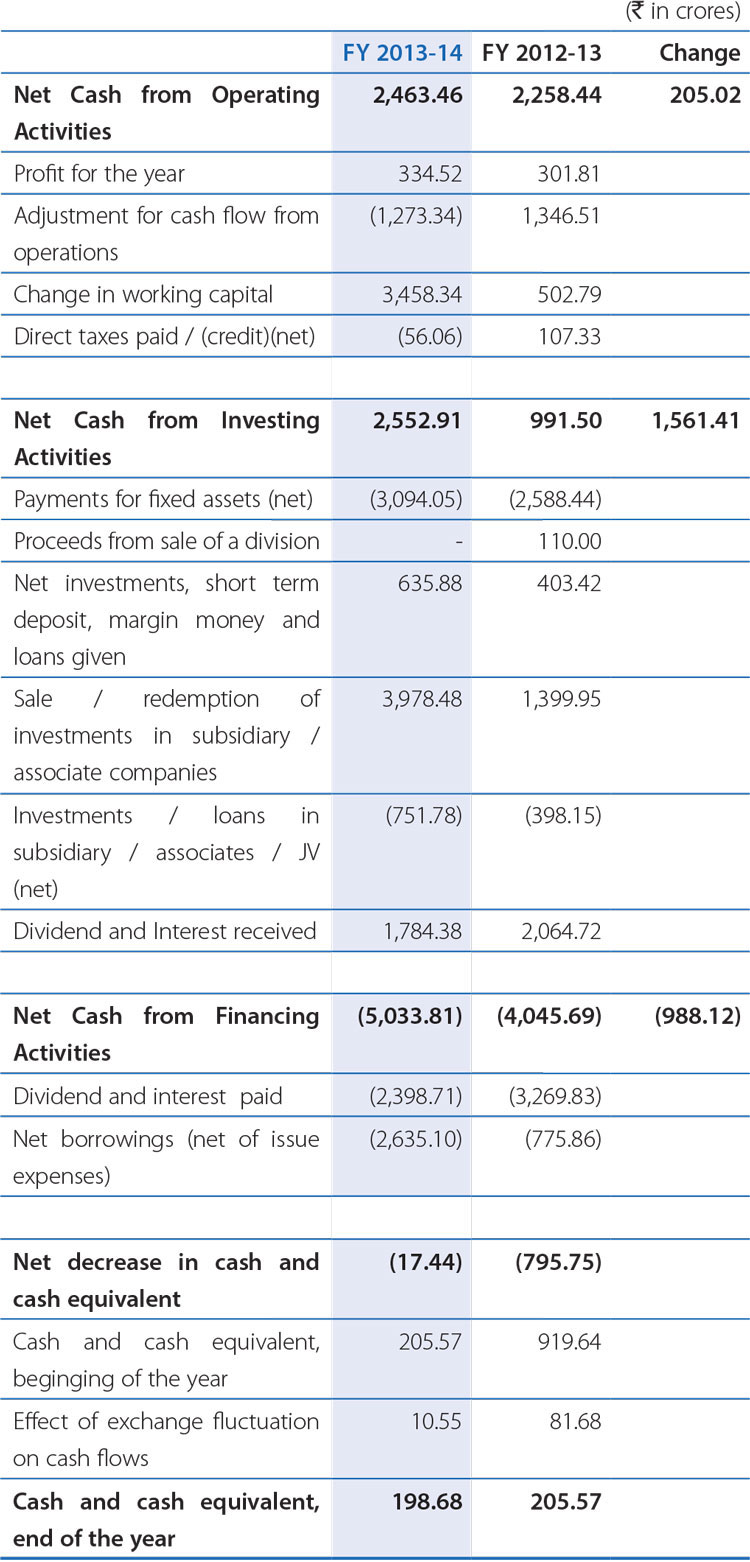
- Reduction in net cash generated from operations reflects impact of reduction in sales and profitability. The cash used in operations before working capital changes was Rs.938.82 crores as compared to net cash generated from operations Rs.1,648.32 crores in the previous year. There was a net inflow of Rs.3,458.34 towards working capital changes mainly attributable to decrease in trade receivables, Inventories and increase in the Trade payable and other current liabilities.
- The net cash inflow from investing activity was Rs.2,552.91 crores as compared to Rs.991.50 crores for the previous year and was mainly attributable to:
- Inflow by way of divestments in foreign subsidiary companies to TML Holdings Pte Ltd, Singapore and Redemption of preference shares by TML Holdings Singapore, resulting in cash inflow of Rs.3,978.48 crores as compared to Rs.1,378.95 crores in FY 2012-13.
- Inflow by way of dividend and interest was Rs.1,784.38 crores (Rs.2,064.72 crores for FY 2012-13).
- The cash used for payments for fixed assets was Rs.3,094.05 crores (net) (Rs.2,588.44 crores for FY 2012-13),
- There was an outflow (net) of Rs.706.72 crores (Rs.203.00 crores for FY 2012-13) towards investments in subsidiary and associates companies.
- The net change in financing activity was an outflow of (Rs.5,033.81 crores) against (Rs.4,045.69 crores) for last year. The outflow is attributable to the following:
- The Company repaid fixed deposits - Rs.362.19 crores (Rs.1,868.38 crores for FY 2012-13).
- The long term borrowings (net) repayment of Rs.579.84 crores (Last year was Rs.814.63 crores).
- Short term borrowings – net outflow of Rs.1,605.27 crores (last year there was inflow of Rs.2,983.74 crores).
FINANCIAL PERFORMANCE OF JLR (AS PER IFRS)
The financial statement of JLR is prepared as per International Financial Reporting Standards (IFRS) applicable in the UK. This information is given to enable the readers to understand the performance of JLR
Revenue: During the year, JLR generated record revenue and profits. This was primarily driven by increased demand for both brands as well as a strong product and market mix. Consolidated revenues for FY 2013-14 were GB£19,386 million, an increase of 22.8% compared to FY 2012-13.
EBITDA: Consolidated EBITDA for FY 2013-14 was a record GB£3,393 million, an increase of 45% compared to FY 2012-13. The EBITDA improvement comprises increased sales volumes and revenues, as well as favourable product and market mix, as higher margin products were sold in higher margin destinations, notably China. Also JLR has been able to keep costs in check, through cost discipline, and various efficiencies and improvement initiatives.
Material cost of sales for the year was GB£11,904 million, equivalent to 61.4% of revenue. This represents an improvement of 1.3% from FY 2012-13 in part due to decreases in raw material prices
Employee costs for FY 2013-14 were up GB£320 million (24%) to GB£1,654 million as JLR has increased permanent and agency headcount, particularly in product development and manufacturing, to support the JLR's growth agenda..
Other expense including those relating to manufacturing, launch, freight and distribution, warranty, product development expense, selling and fixed marketing, were GB£3,717 million in the year, an increase of GB£642 million (21%) versus FY 2012-13. From FY 2013-14 onwards EBITDA now includes mark to market of current assets and liabilities and realised gains on matured FX and commodity hedges for the full year in line with policy under IFRs accounting.
Development costs of GB£1,266 million represent an increase of GB£208 million (20%). This reflected the increased spend on future model development for both brands. Of the total spending, GB£1,030 million was capitalised (last year GB£ 860 million).
Profit before tax (PBT) for FY 2013-14 was GB£2,501 million, an increase of GB£827 million (49%) compared to FY 2012-13. PBT performance reflects higher EBITDA plus gains of GB£137 million arising from mark to market of unrealised FX options and commodity hedges and revaluation of foreign currency loans. This compares to a GB£47 million loss in FY 2012-13. PBT also captures depreciation and amortization charges, up GB£253 million to GB£875 million for FY 2013-14 given increased product development and facilities investment. Higher net finance expense of GB£154 million includes GB£62 million of one off costs incurred in the redemption of the higher coupon GB£500 million and US$410 million 2018 notes (at 8.125% and 7.75% coupon respectively) and a GB£47 million reversal of gain on related bond call options. The bond redemption was pre-financed by the successful issuances of US$700 million 4.125% 2018 notes and GB£400 million 5% 2022 notes. This served to reduce JLR's overall cost of debt in line with the improving credit and market conditions.
Profit after tax, at an effective rate of 25%, was GB£1,879 million.
Cash Flow
Net cash from operating activities was GB£3,422 million in FY 2013- 14, in line with profits plus positive working capital of GB£393 million versus GB£382 million in prior period, less tax paid of GB£402 million (GB£248 million in FY 2012-13). This compares to operating cash flow of GB£2,429 million in FY 2012-13. JLR invested significantly in the year, up GB£527 million to GB£2,444 million for the year. This demonstrates JLR's commitment to product development and also capacity increases, including facilities in China and the UK. Net cash used in financing activities was GB£498 million in FY 2013-14 compared to GB£178 million in FY 2012-13. In FY 2013-14 financing activities included early redemption of GB£750 million equivalent of higher coupon long term bonds through tender/exercise of call option in Q4 pre-financed by the issuance of US$700 million bond in December 2013 and GB£400 million bond in January 2014. Financing activities also included a dividend paid to parent company of GB£150 million, GB£79 million of debt repayments, and interest and fees of GB£269 million.
Financial performance of TMFL
During FY 2013-14, TMFL earned a total income of Rs.3,026.47 crores, against an income of Rs.2,825.64 crores earned during the previous year, reflecting an increase of 7.1%. The Profit Before Tax declined by 65% to Rs.155.33 crores (Previous year: Rs.449.49 crores). The Profit After Tax at Rs.100.88 crores was 67% lower than that in the previous year (Rs.309.30 crores).The results for FY 2013-14 have been impacted due to tightness in the financial market, stress in the business environment and the consequent higher provision on account of Non-Performing Assets.
Financial performance of TDCV (as per Korean GAAP)
During FY 2013-14, TDCV's total revenue was KRW 884.08 billion (Rs.4,906.46 crores) higher by 7.3% compared to KRW 823.92 billion (4,024 crores) in FY 2012-13. TDCV reported Profit before Tax of KRW 30.52 billion (Rs.169.39 crores) as compared to Loss before tax of KRW 10.44 billion (Rs.51.00 crores) in FY 2012-13. After providing for tax, the Profit for the year stood at KRW 23.49 billion (Rs.130.37 crores), against loss of KRW 9.21 billion (Rs.44.96 crores) in FY 2012-13. In FY 2012-13 provision of KRW 18.9 Billion (Rs.92.27 crores) was made on account of court verdict in the Ordinary Wage Lawsuit filed by the Union Employees of TDCV.
Financial performance of TTL
The consolidated revenue in FY 2013-14 was Rs.2,394.73 crores, an increase of 17.08% against Rs.2,045.42 crores in the previous year. The profit before tax was Rs.337.57 crore as against Rs.392.43 crore in the previous year, recording a reduction of 14%. The profit after tax stood at Rs.273.22 crore as against Rs.300.73 crore recording a reduction of 9.2%.
Opportunities and Risks – JLR and Tata Motors businesses constitute a significant portion of Revenue, Income and assets / liabilities. Accordingly, we have given below key opportunities and risks.