


 83 / 370

Notice
Board’s Report
Management Discussion & Analysis Corporate Governance Report
Business Responsibility Report
81
TO THE MEMBERS OF TATA MOTORS LIMITED
The Directors present their Seventy Second Annual Report along with the Audited Statement of Accounts for Fiscal 2017.
Pursuant to the notification issued by the Ministry of Corporate Affairs on February 16, 2015 and under the Companies (Indian Accounting
Standards) Rules, 2015 and other accounting principles generally accepted in India, the Company has adopted Indian Accounting Standards
on April 1, 2016, with the transition date as April 1, 2015. Fiscal 2016 Financial Statements have been prepared in accordance with the
recognised and measurement principles stated therein.
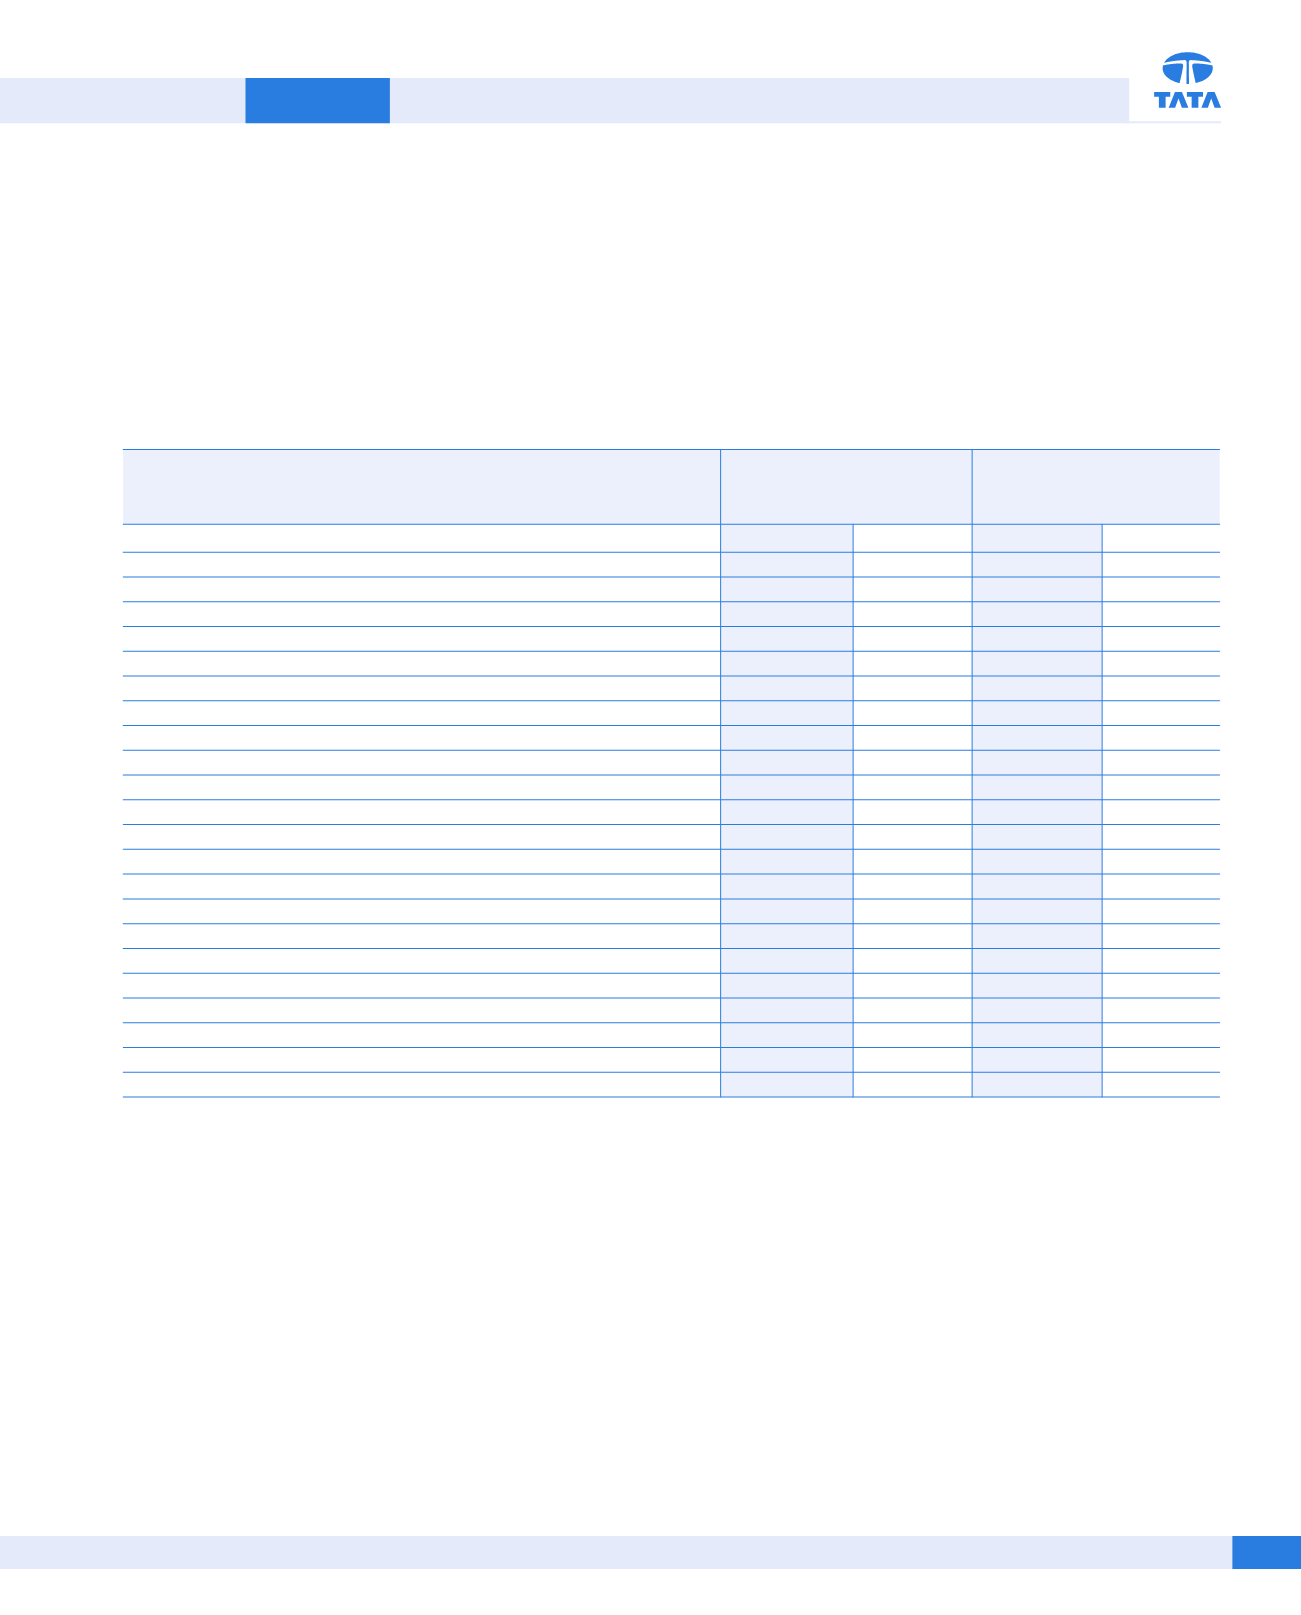
FINANCIAL PERFORMANCE SUMMARY
BOARD’S REPORT
(
`
in crores)
Tata Motors
(Standalone)*
Tata Motors Group
(Consolidated)
Fiscal 2017 Fiscal 2016 Fiscal 2017 Fiscal 2016
FINANCIAL RESULTS
Income from operations
49,100.41
47,383.61
2,74,492.12
2,77,660.59
Total expenditure
47,399.74
44,018.78
2,37,579.76
2,35,884.31
Operating profit
1,700.67
3,364.83
36,912.36
41,776.28
Other Income
978.84
1,402.31
754.54
885.35
Profit before interest, depreciation, amortization, exceptional item and tax
2,679.51
4,767.14
37,666.90
42,661.63
Finance costs
1,590.15
1,592.00
4,238.01
4,889.08
Cash profit
1,089.36
3,175.14
33,428.89
37,772.55
Depreciation, amortization and product development/ engineering expenses
3,423.87
2,747.49
21,318.56
20,179.55
Foreign exchange (gain)/loss (net)
(252.45)
222.91
3,910.10
1,616.88
Profit/(loss) for the year before exceptional items and tax
(2,082.06)
204.74
8,200.23
15,976.12
Exceptional Items - loss (net)
338.71
271.84
(1,114.56)
1,850.35
Profit/(loss) before tax
(2,420.77)
(67.10)
9,314.79
14,125.77
Tax expenses/(credit) (net)
59.22
(4.80)
3,251.23
3,025.05
Profit/(loss) after tax
(2,479.99)
(62.30)
6,063.56
11,100.72
Share of profit of joint ventures and associates (net)
-
-
1,493.00
577.47
Profit/(loss) for the year
(2,479.99)
(62.30)
7,556.56
11,678.19
Other comprehensive income/(loss)
95.48
85.47
(27,494.57)
3,157.46
Total Other comprehensive income/(loss) for the year
(2,384.51)
23.17
(19,938.01)
14,835.65
Attributable to:
(a) Shareholders of the Company
(20,005.94)
14,724.64
(b) Non-controlling interest
67.93
111.01
DIVIDEND
Considering the continued weak operating environment in the
standalone business and in viewof the losses for the year, no dividend
is permitted to be paid to the Members for Fiscal 2017, as per the
Companies Act, 2013 (“the Act”) and the Rules framed thereunder.
TRANSFER TO RESERVES
In Fiscal 2016, an additional amount has been transferred from
retained earnings to Debenture Redemption Reserve (DRR) on
outstanding Non-Convertible Debentures (NCDs) and Senior Notes
(including interest accrued where applicable) of
`
43.79 crores.
Due to losses in Fiscal 2017, resulting in debit balance in retained
earnings no amount has been transferred to DRR on the NCDs
allotted in Fiscal 2017.
OPERATING RESULTS AND PROFITS
Fiscal 2017 has been marked by couple of ‘Black Swan’ events (like
Brexit -UK decision to exit EU and Demonetization in India) having
a large impact on the future course of developments. This year was
marked by the way for the long awaited and transformational Goods
and Service Tax (GST).
Growth of World GDP has been 3.1% in Fiscal 2016. A recovery in
commodity prices has provided some relief to commodity exporters
and helped in reducing the deflationary pressures. The Orgainisation
of the Petroleum Exporting Countries (OPEC) ability to increase
price by cutting down production has been curtailed by rising
Shale gas output in US. Moreover, structural problems such as low
productivity growth and high-income inequality persisted and are
* These include the Company’s proportionate share of income and expenditure in its two Joint Operations, namely Tata Cummins Pvt Ltd and Fiat India Automobiles Pvt Ltd.