


 66 / 370

64
CORPORATE OVERVIEW
Notes :
@
On increased capital base due to conversion of Bonds / Convertible Debentures / Warrants / FCCN into shares.
*
To a face value of
`
10/- per share upto 2011-12.
#
Includes Interim Dividend where applicable.
!
Includes a special dividend of
`
2.50 per share for the Diamond Jubilee Year.
++
On increased capital base due to Rights issue and conversion of FCCN into shares.
^
On increased capital base due to GDS issue and conversion of FCCN into shares.
^^
On increased capital base due to QIP issue and conversion of FCCN into shares.
**
Consequent to sub-division of shares, figures for previous years are not comparable.
## Includes reversal of dividend distribution tax of earlier year.
+++ On increased capital base due to Rights issue.
^^^
The figures of FY 2016-17 is as per Ind AS
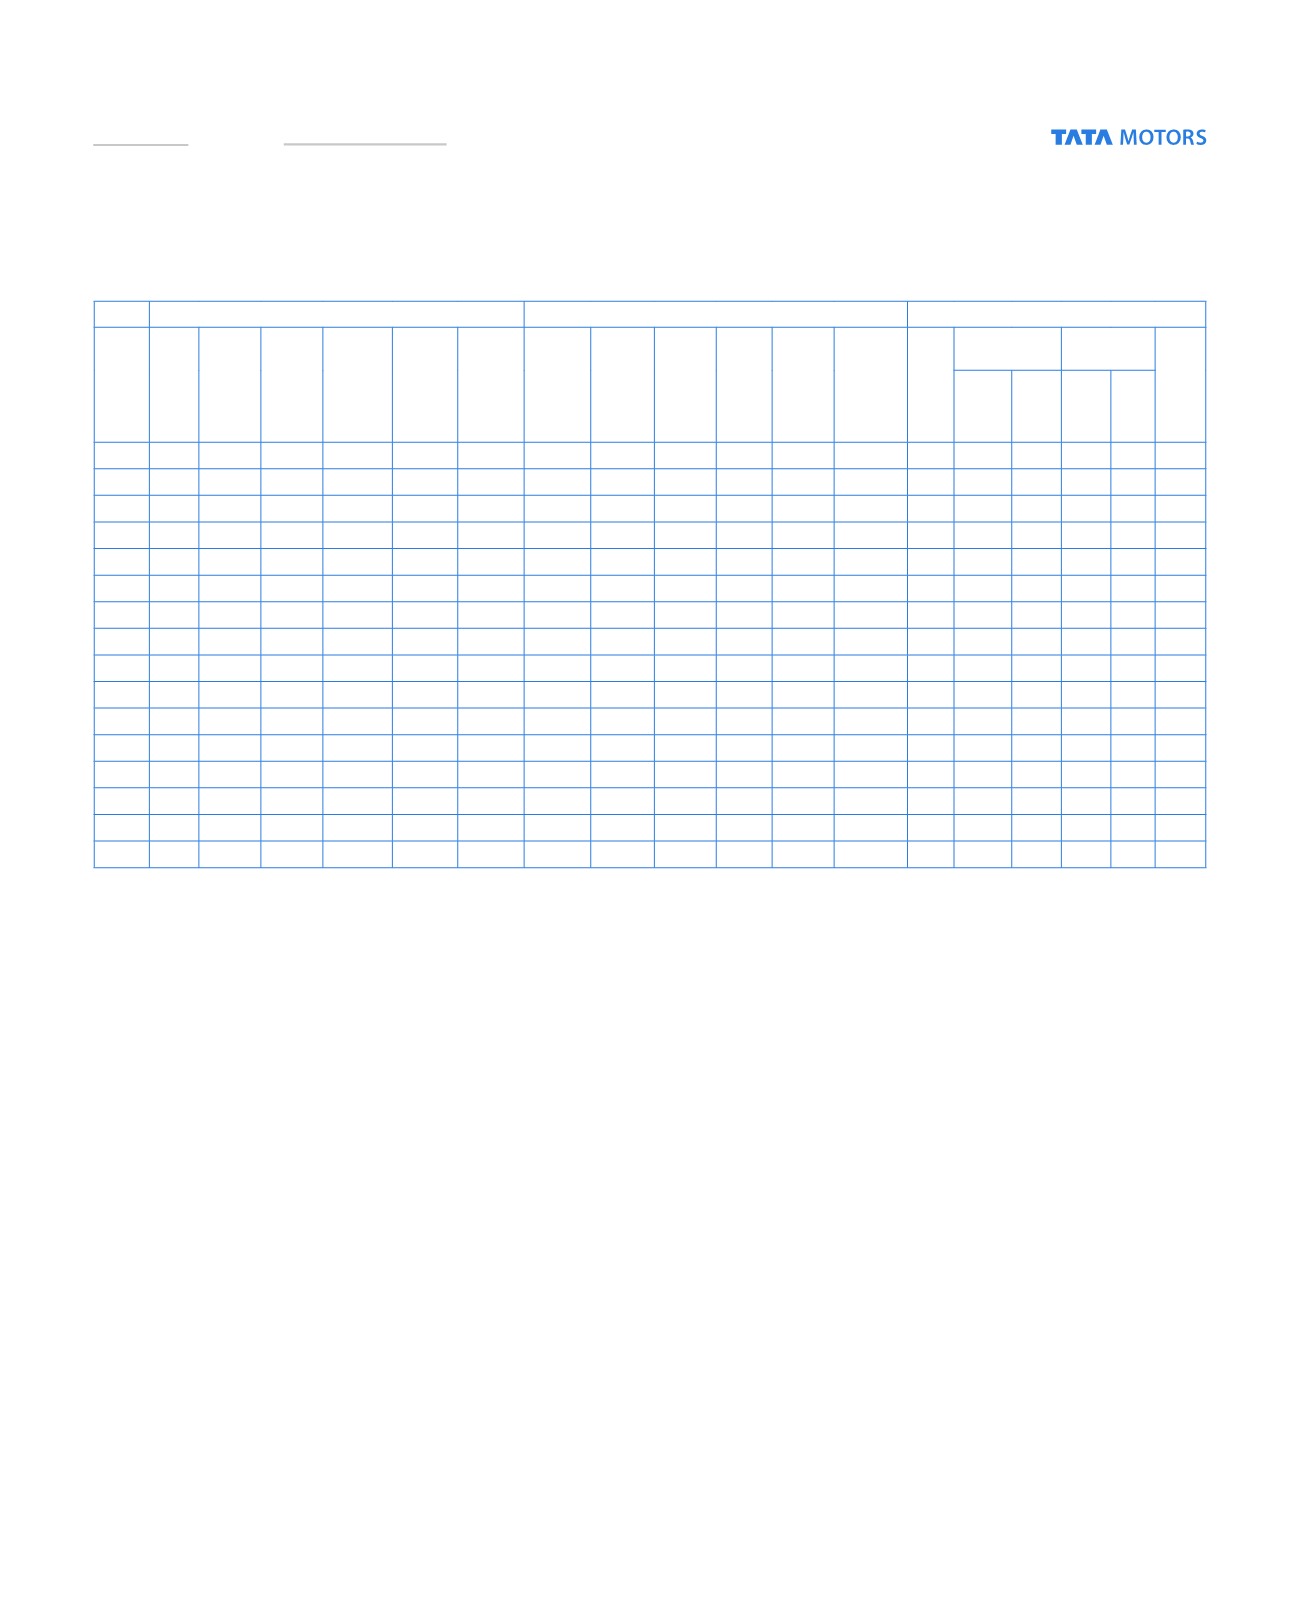
CAPITAL ACCOUNTS (
`
in lakhs)
REVENUE ACCOUNTS (
`
in lakhs)
RATIOS
Year
Capital
Reserves
and Surplus
Borrowings Gross Block
(including
CWIP)
Accumulated
Depreciation
Net Block Turnover Depreciation Profit/ (Loss)
Before
Taxes
Taxes Profit/ (Loss)
AfterTaxes
Dividend
including tax
(including
group’s share
of Subsidiaries
dividend tax)
PAT to
Sales
Earnings Per Share
(Basic)* (
`
)
Dividend Per
Share*# (
`
)
NetWorth
Per Share*
(
`
)
Ordinary
Share
‘A’
Ordinary
Share
Ordinary
Share
‘A’
Ordinary
Share
2001-02 31,982 183
,617 282,031
634,984 252,475
382,509
932,220
39,222 (18,015) (6,740) (10,719)
45 -1.1% (3.95)
-
-
-
66@
2002-03 31,983 190,018 178,965
648,959 284,038
364,921 1,144,801
40,190
54,350 22,640
29,712
14,497 2.6% 9.29
-
4.00
-
66
2003-04 35,683 329,884 169,842
728,468 323,749
404,719 1,634,104
42,556 144,487 53,077
91,529
32,099 5.6% 27.88
-
8.00
- 104@
2004-05 36,179 403,537 271,420
834,162 375,933
458,229 2,284,217
53,101 184,809 49,062 138,534
52,346 6.1% 38.50
- 12.50!
- 121@
2005-06 38,287 574,860 337,914 1,027,949 484,356
543,593 2,750,725
62,331 234,898 64,000 172,809
58,439 6.3% 45.86
-
13.00
- 160@
2006-07 38,541 733,626 730,190 1,294,083 542,665
751,418 3,707,579
68,809 308,800 88,321 216,999
68,822 5.9% 56.43
-
15.00
- 200@
2007-08 38,554 831
,198 1,158,487 1,892,393 606,049 1,286,344 4,060,827
78,207 308,629 85,154 216,770
67,674 5.3% 56.24
-
15.00
- 225@
2008-09 51,405 542,659 3,497,385 6,900,238 3,326,905 3,573,333 7,489,227 250,677 (212,925) 33,575 (250,525)
36,458 -3.3% (56.88) (56.88)
6.00
6.50 114++
2009-10 57,060 763,588 3,519,236 7,291,985 3,441,352 3,850,633 9,736,054 388,713 352,264 100,575 257,106
100,185 2.6% 48.64
49.14
15.00 15.50
144^
2010-11 63,771 1,853,376 3,281,055 8,291,975 3,969,870 4,322,105 12,684,370 465,551 1,043,717 121,638 927,362
148,130 7.3% 155.25 155.75
20.00 20.50 302^^
2011-12 63,475 3,206,375 4,714,896 10,572,497 4,951,247 5,621,250 17,133,935 562,538 1,353,387 (4,004) 1,351,650
148,862 7.9% 42.58** 42.68** 4.00** 4.10** 103
2012-13 63,807 3,699,923 53,71,571 121,58,556 5,172,265 6,986,291 19,451,406 760,128 1,364,733 377,666 989,261
75,614 5.1% 31.02
31.12
2.00
2.10 118@
2013-14 64,378 6,495,967 6,064,228 16,619,078 6,881,538 9,737,540 23,745,502 1,107,816 1,886,897 476,479 1,399,102
69,008
##
5.9% 43.51
43.61
2.00
2.10 204@
2014-15 64,378 5,561,814 7,361,039 18,684,665 7,442,406 11,242,259 26,760,664 1,338,863 2,170,256 764,291 1,398,629
(3,319)
##
5.2% 43.44
43.54
-
-
175
2015-16 67,918 8,010,349 7,046,849 21,639,756 8,754,689 12,885,067 28,107,844 1,701,418 1,398,087 287,260 1,102,375
11,052 3.9% 32.61
32.71
0.20
0.30 238+++
2016-17 67,922 5,738,267 7,860,398 19,653,773 6,756,813 12,896,960 27,524,666 1,790,499 931,479 325,123 745,436
- 2.7% 21.94
22.04
-
-
171
FINANCIAL STATISTICS
COMPANY (CONSOLIDATED)