


 63 / 370

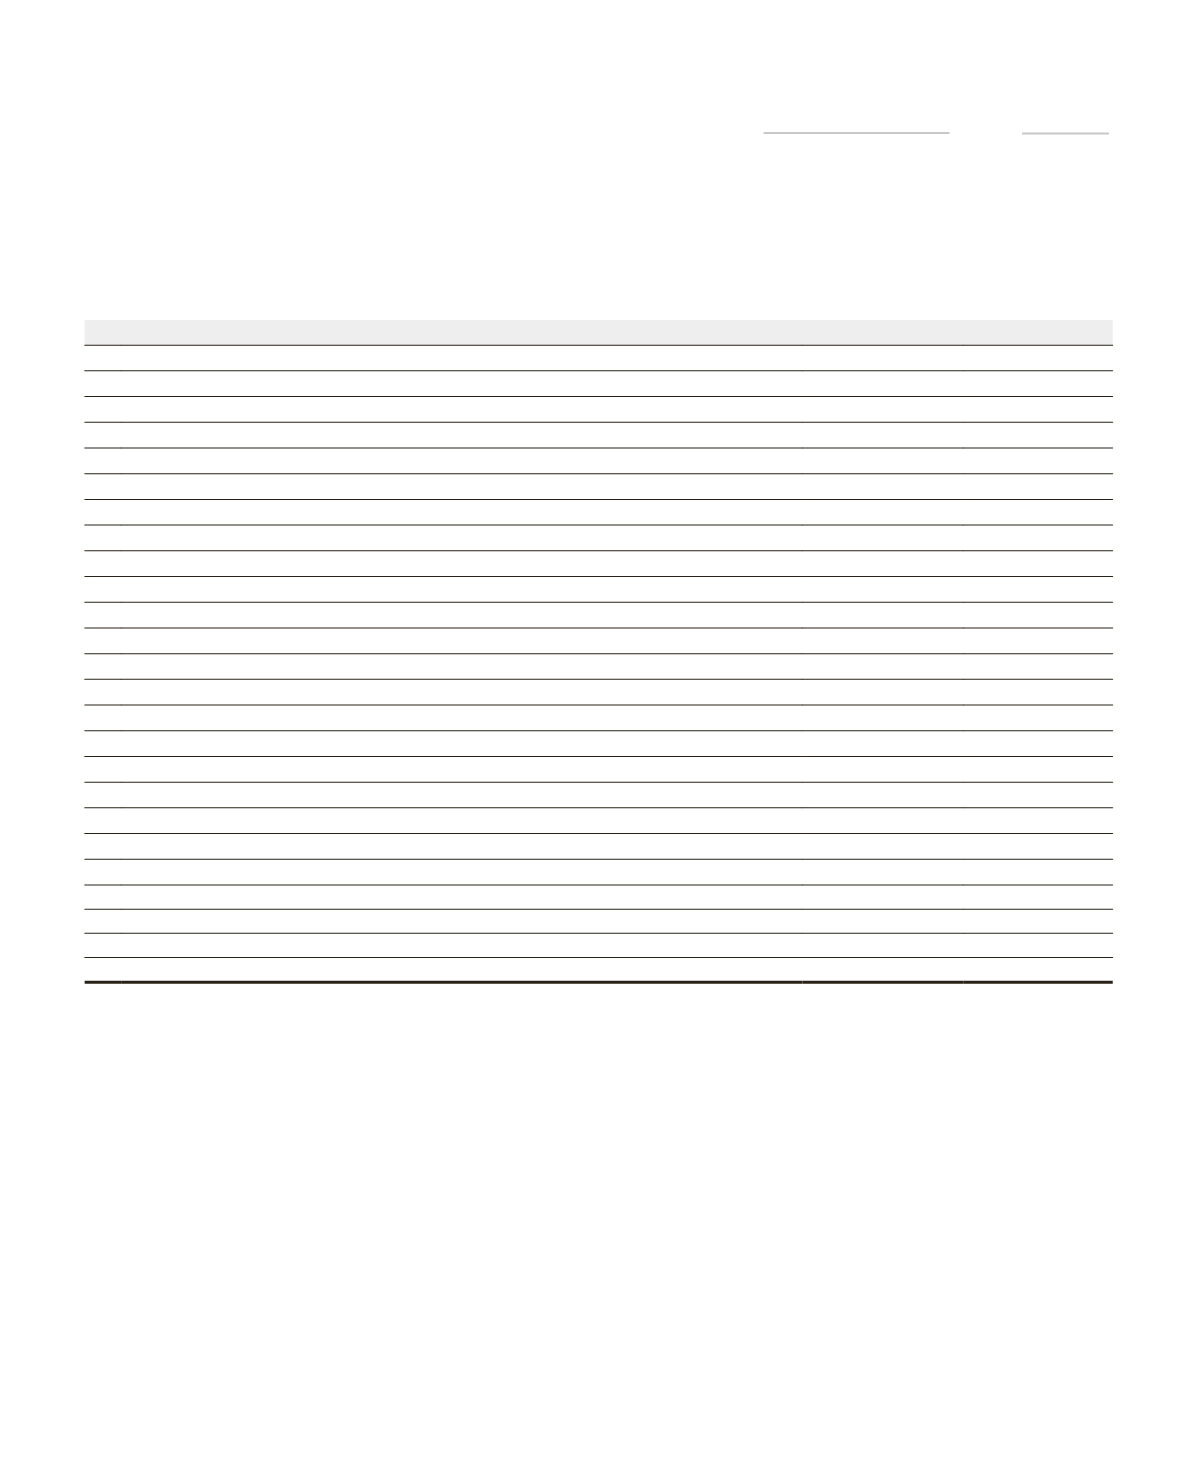
61
(
`
in crores)
2016-2017
2015-2016
1 INCOME
Income from operations
49,100.41
47,383.61
Other income
978.84
1,402.31
Total
50,079.25
48,785.92
2 EXPENDITURE
Cost of materials consumed
27,654.40
24,997.40
Purchase of products for sale
3,945.97
4,101.97
Changes in inventories of finished goods, work-in-progress and products for sale
(251.43)
10.05
Excise duty
4,736.41
4,538.14
Employee benefits expense
3,558.52
3,188.97
Finance costs
1,590.15
1,592.00
Foreign exchange (gain)/loss (net)
(252.45)
222.91
Depreciation and amortisation expense
2,969.39
2,329.22
Product development/Engineering expenses
454.48
418.27
Other expenses
8,697.42
8,216.65
Amount capitalised
(941.55)
(1,034.40)
Total Expenses
52,161.31
48,581.18
Profit/(loss) before exceptional items and tax
(2,082.06)
204.74
Employee separation cost
67.61
10.04
Others
271.10
261.80
3 PROFIT BEFORE TAX FROM CONTINUING OPERATIONS
(2,420.77)
(67.10)
4
Tax expense (net)
59.22
(4.80)
5 PROFIT AFTER TAX FROM CONTINUING OPERATIONS (3-4)
(2,479.99)
(62.30)
6 TOTAL OTHER COMPREHENSIVE INCOME/(LOSS)
95.48
85.47
7 TOTAL COMPREHENSIVE INCOME/(LOSS) FOR THE YEAR
(2,384.51)
23.17
SUMMARISED STATEMENT OF PROFIT AND LOSS
(STANDALONE)
72nd Annual Report 2016-17