


 167 / 370

Notice
Board’s Report
Corporate Governance Report
Business Responsibility Report
Management Discussion & Analysis
165
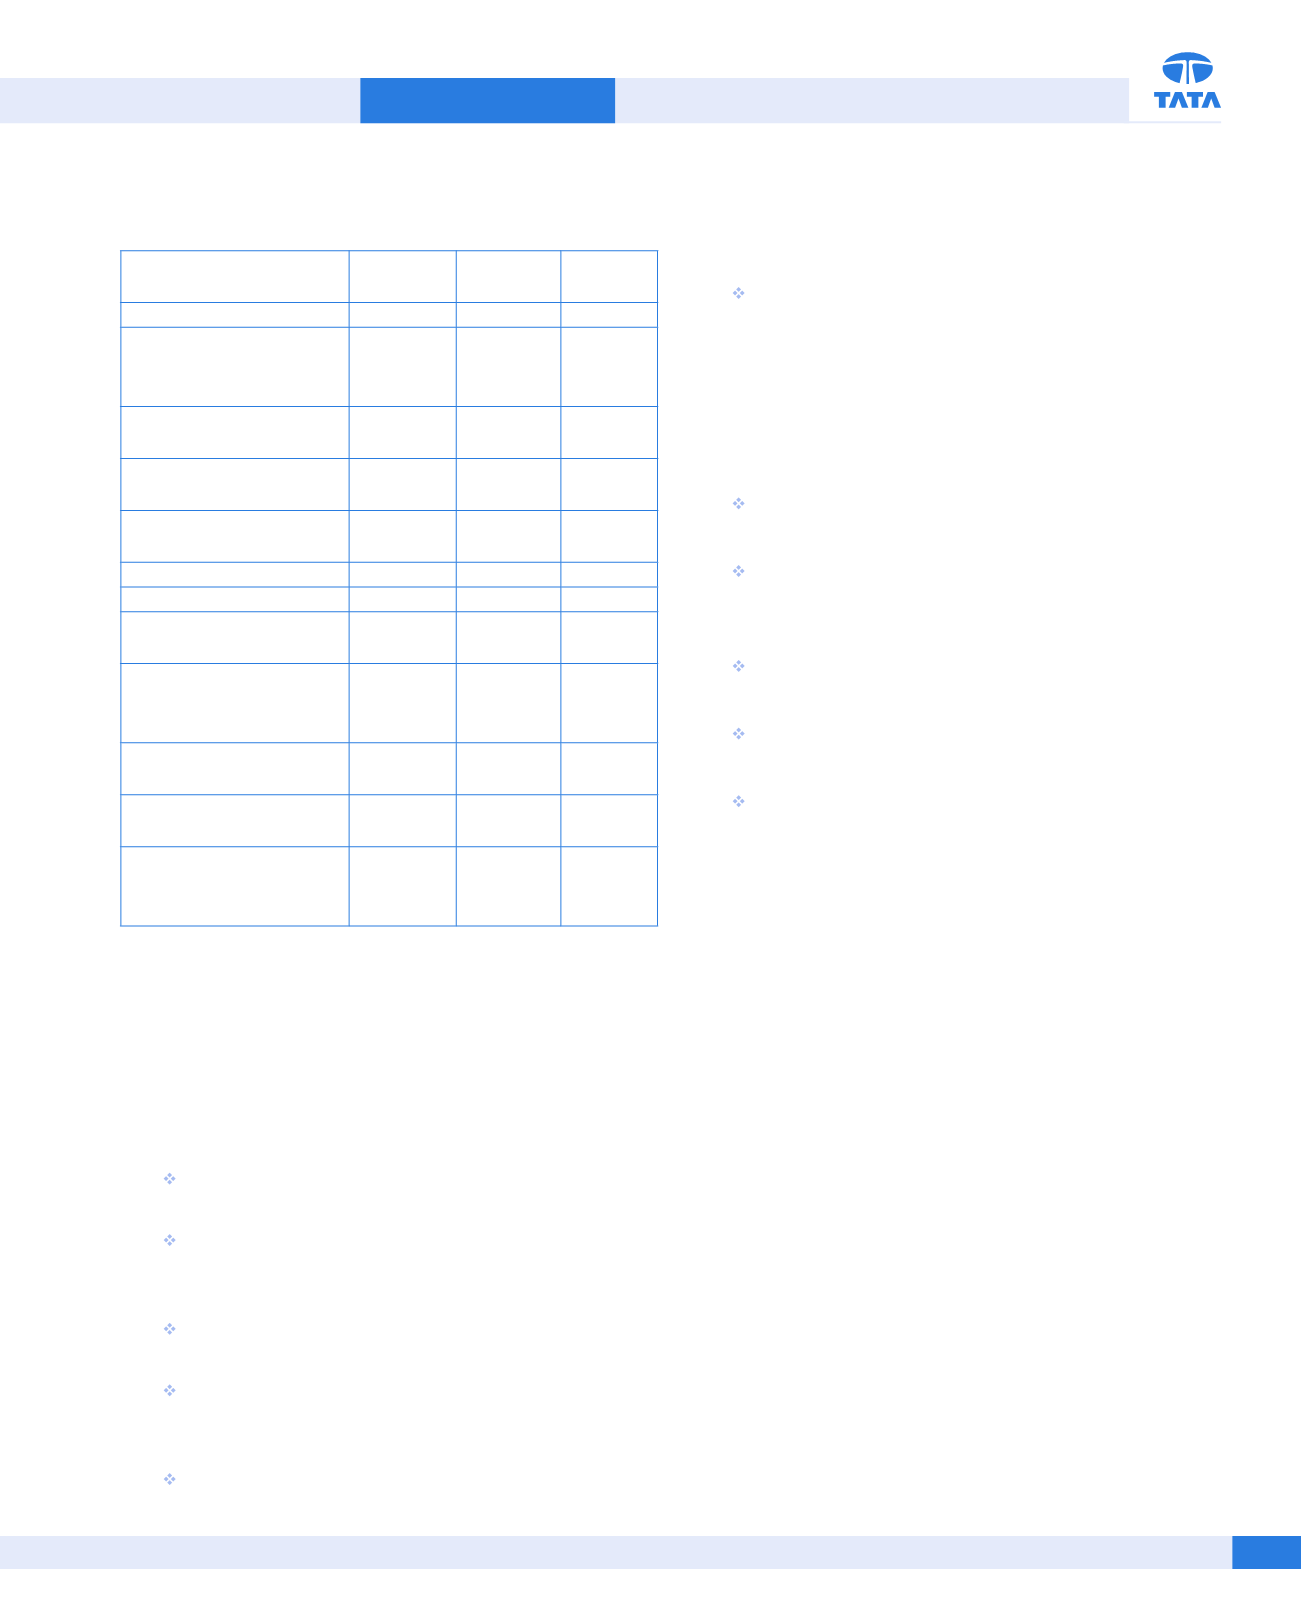
Net cash used in
investing activities
(2,737.98) (3,264.22)
526.24
Payment for Assets (net)
(3,411.58)
(3,249.21)
Net investments, short
term deposit, margin
money and loans given
(259.01)
(1,311.37)
Dividend and interest
received
932.61
1,296.36
Net Cash from/(used in)
financing activities
1,119.21
(78.87) 1,198.08
Proceeds from issue of
shares
4.55
7,433.22
Dividend Paid
(73.00)
-
Interest paid
(1,957.59)
(2,085.91)
Net Borrowings (net of
issue expenses)
3,145.25
(5,426.18)
Net increase / (decrease)
in cash and cash
equivalent
(237.30)
(640.11)
Cash and cash equivalent,
beginning of the year
427.07
1,066.47
Effect of exchange
fluctuation on cash flows
(1.38)
0.71
Cash and cash
equivalent, end of the
year
188.39
427.07
a)
Decrease in net cash from operations reflects loss in Fiscal 2017.
The cash from operations before working capital changes was
R
1,548.97 crores in Fiscal 2017 compared to
R
3,502.42 crores
in Fiscal 2016. There was net outflow of
R
73.75 crores in Fiscal
2017 towards working capital changes.
b)
The net cash used in investing activities was
R
2,737.98 crores
in Fiscal 2017 compared to
R
3,264.22 crores in Fiscal 2016,
mainly attributable to:
Investments in mutual funds in Fiscal 2017 was
R
537.40
crores as compared to
R
1,669.02 crores in Fiscal 2016.
The cash used for payments for fixed assets was
R
3,411.58
crores (net) in Fiscal 2016 compared to
R
3,249.21 crores
in Fiscal 2016.
Inflow by way of divestments in subsidiary companies
resulting in cash inflow of
R
746.90 crores in Fiscal 2016.
Inflow due to dividends and interest in Fiscal 2017 was
R
932.61 crores as compared to
R
1,296.36 crores in Fiscal
2016.
There was an inflow (net) of
R
264.29 crores in Fiscal 2017
compared to an outflow of
R
227.49 crores for Fiscal 2016
towards Fixed / restricted deposits.
There was an outflow (net) of
R
139.08 crores in
Fiscal 2017 compared to inflow of
R
613.81 crores for
Fiscal 2016 towards investments in subsidiary, joint
arrangements and associate companies.
c)
The net change in financing activity was an inflow of
R
1,119.21
in Fiscal 2017 against outflow of
R
78.87 crores in Fiscal 2016.
The outflow is attributable to:
Long-term borrowings (net) – inflow of
R
1,474.30 crores
in Fiscal 2017 as compared to outflow of
R
949.90 crores.
Short-term borrowings (net) – inflow of
R
1,670.95 crores
in Fiscal 2017 as compared to outflow of
R
4,476.28
crores.
During Fiscal 2016, the Company raised
R
7,433.22 crores
through rights issue of shares.
In Fiscal 2017, the Company paid dividend of
R
73.00
crores.
In Fiscal 2017, interest payment was
R
1,957.59 crores as
compared to
R
2,085.91 crores in Fiscal 2016.
FINANCIAL PERFORMANCE OF JAGUAR LAND ROVER (AS
PER IFRS)
The financial statements of Jaguar Land Rover are prepared in
accordance with International Financial Reporting Standards (IFRS)
applicable in the United Kingdom. This information is given to
enable the readers to understand the performance of Jaguar Land
Rover on a consolidated basis for the Jaguar Land Rover group.
Revenues for Jaguar Land Rover for Fiscal 2017 were GB£24,339
million, an increase of 9.2% compared to GB£22,286 million in Fiscal
2016, driven primarily by increased wholesale volumes and a more
favourable foreign exchange environment with the weaker pound
following Brexit.
Material and other cost of sales in Fiscal 2017 were GB£15,071
million were 12.4% higher compared to the GB£13,405 million in
Fiscal 2016 (and increased as a proportion of revenue to 61.9% in
Fiscal 2017 compared to 60.1% in Fiscal 2016) primarily driven by
the increase in sales volumes and the weaker pound.
Employee costs increased by 7.3% to GB£2,490 million in Fiscal 2017
compared to GB£2,321 million in Fiscal 2016, primarily reflecting
increased headcount in manufacturing (to support the increase in
production volumes) and product development to support Jaguar
Land Rover’s plans to launch new models.