71
Notice
Directors’ Report
(69-103)
Management Discussion & Analysis
Corporate Governance
Secretarial Audit Report
The Company’s commercial vehicle sales in the domestic and
international markets at 420,992 units were 27.5% lower than the
previous year.
Even under these difficult conditions, the Company has been able
to gain market share in the critical M&HCV segment. The Company
has been focusing intensely on market and customer activities
to stimulate the buying sentiments. Activities included the Prima
Truck Racing Championship event in March, 2014 the first of its kind
initiative in the Indian trucking history. The Prima LX series of trucks –
a combination of economy &technology - were launched in FY2013-
14 which included – 2523T, 3123T, 4028S (Single reduction and Hub
reduction) and 4928S (Single reduction and Hub reduction), 4923.S
LX, Prima 4938 Tractor, 3138K Tipper, LPT 3723 - India’s first 5 axle
truck and LPK 3118, and Prima LX series of Tippers – 2523K, 3123K,
2528K & 3128K. One of the successful marketing initiatives was the
Power of Five campaign for M&HCV trucks which was conducted
across various locations across the country to counter competition.
The campaign focuses on five advantages of the Company’s
vehicles – 1) Better KMPL, 2) Best Vehicle Uptime 3) Highest Resale
Value, 4) Best in class four year warranty, 5) Lowest maintenance
cost and five powerful offerings – i) Triple benefit insurance, ii)
Increased Oil change interval, iii) 4 Year AMC, iv) Tata Alert, v)
Fleetman. The bus segment also witnessed growthin market share
for the Company, due to intensive sales efforts coupled with launch
of buses with mechanical FIP, introduction of Starbus Ultra in Stage
carriage, marketing initiatives such as ‘Humare Bus Ki Baat Hain’ and
‘Dream it to win it’ program. The warranty for M&HCV buses and
trucks were increased to three years and four years respectively
symbolizing improvement in quality. The Tata Alert service, to
return a vehicle back on road within 48 hours, has been expanded
across all national highways.
The Company registered a decline in the market share of LCV
segment due to the sharp fall in volumes of the high share SCV
segment. The newly launched Ultra trucks have started to receive
good response from the market. There have been various other
initiatives such as the Freedom campaign and Triumph through
trials campaign of back-to-back and standalone fuel trials to
establish the superior fuel efficiency of vehicles. The Company tied
up with various PCGs (Public sector, Co-operative & Gramin banks)
and has brought out several lucrative financing schemes to ease the
financing situation. The Companyalso launched a major initiative
called, ‘Saathi’, a Parts retailers’ customer referral program for entire
SCV range, to leverage their customer base. Some of launches this
year were the Ace, Magic DICOR and facelifts.
Passenger Vehicles:
The Passenger Vehicle Industry contracted for the first time in the
last five years, in FY 2013-14 with decline of 4.7%. The last such
instance was during the economic slowdown of FY 2008-09 when
it remained close to flat at negative 0.5%. The decline in sales
volumes is seen across segments, but sedans bore the biggest
brunt. Hatchbacks and UV’s continue to be the volume segments.
The high growth in UV segment last year, with the onset of Soft
Roaders could not be repeated this year. The premium and luxury
vehicles segment however has seen a growth even in an otherwise
declining year.
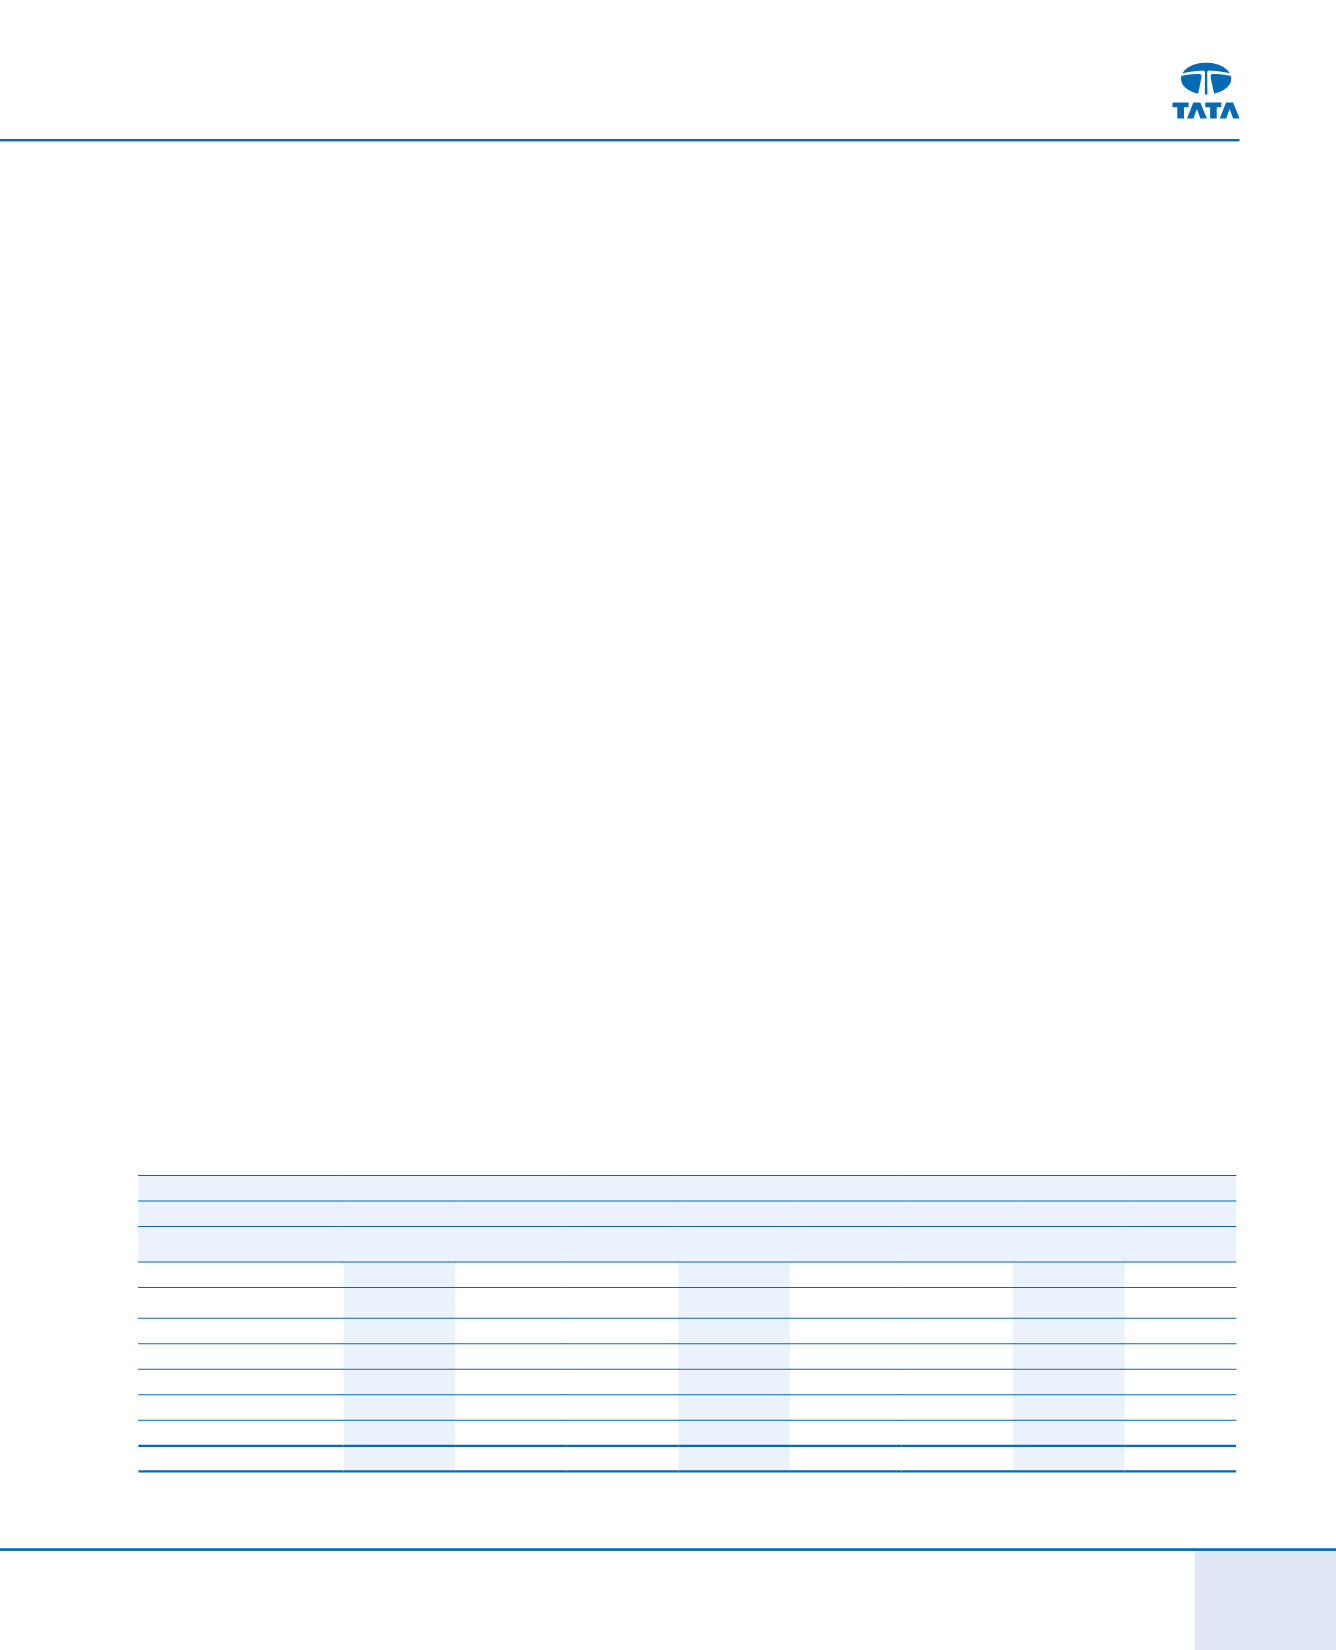
The domestic performance in passenger vehicle segment is given
below:
Category
Industry Sales
Company Sales
Market Share
FY 2013-14 FY 2012-13
Growth FY 2013-14 FY 2012-13
Growth FY 2013-14
FY 2012-13
Units
Units
Units
Units
Micro
21,130
53,847
-60.8%
21,130
53,847
-60.8% 100.0% 100.0%
Compact
786,888
794,284
-0.9%
84,141
117,377
-28.3%
10.7%
14.8%
Midsize
154,981
200,013
-22.5%
2,414
7,410
-67.4%
1.6%
3.7%
Executive
18,272
23,537
-22.4%
164
1,061
-84.5%
0.9%
4.5%
Premium & Luxury
3,973
5,214
-23.8%
1,430
825
73.3%
36.0%
15.8%
Utility Vehicles
532,963
560,892
-5.0%
29,409
45,841
-35.8%
5.5%
8.2%
Vans
118,618
123,254
-3.8%
3,158
2,964
6.5%
2.7%
2.4%
Total
2,438,502
2,557,566
-4.7%
141,846
229,325
-38.1%
5.8%
9.0%
Source: Society of Indian Automobile Manufacturers report and Company Analysis
Note (a): excludes V2 Van sales
Note (b): Total industry nos. includes sale in other segments


