35
FINANCIAL
PERFORMANCE
(32-35)
Financial Performance
Summarised Balance Sheet and Statement of Profit and Loss (Consolidated)
Awards and Accolades
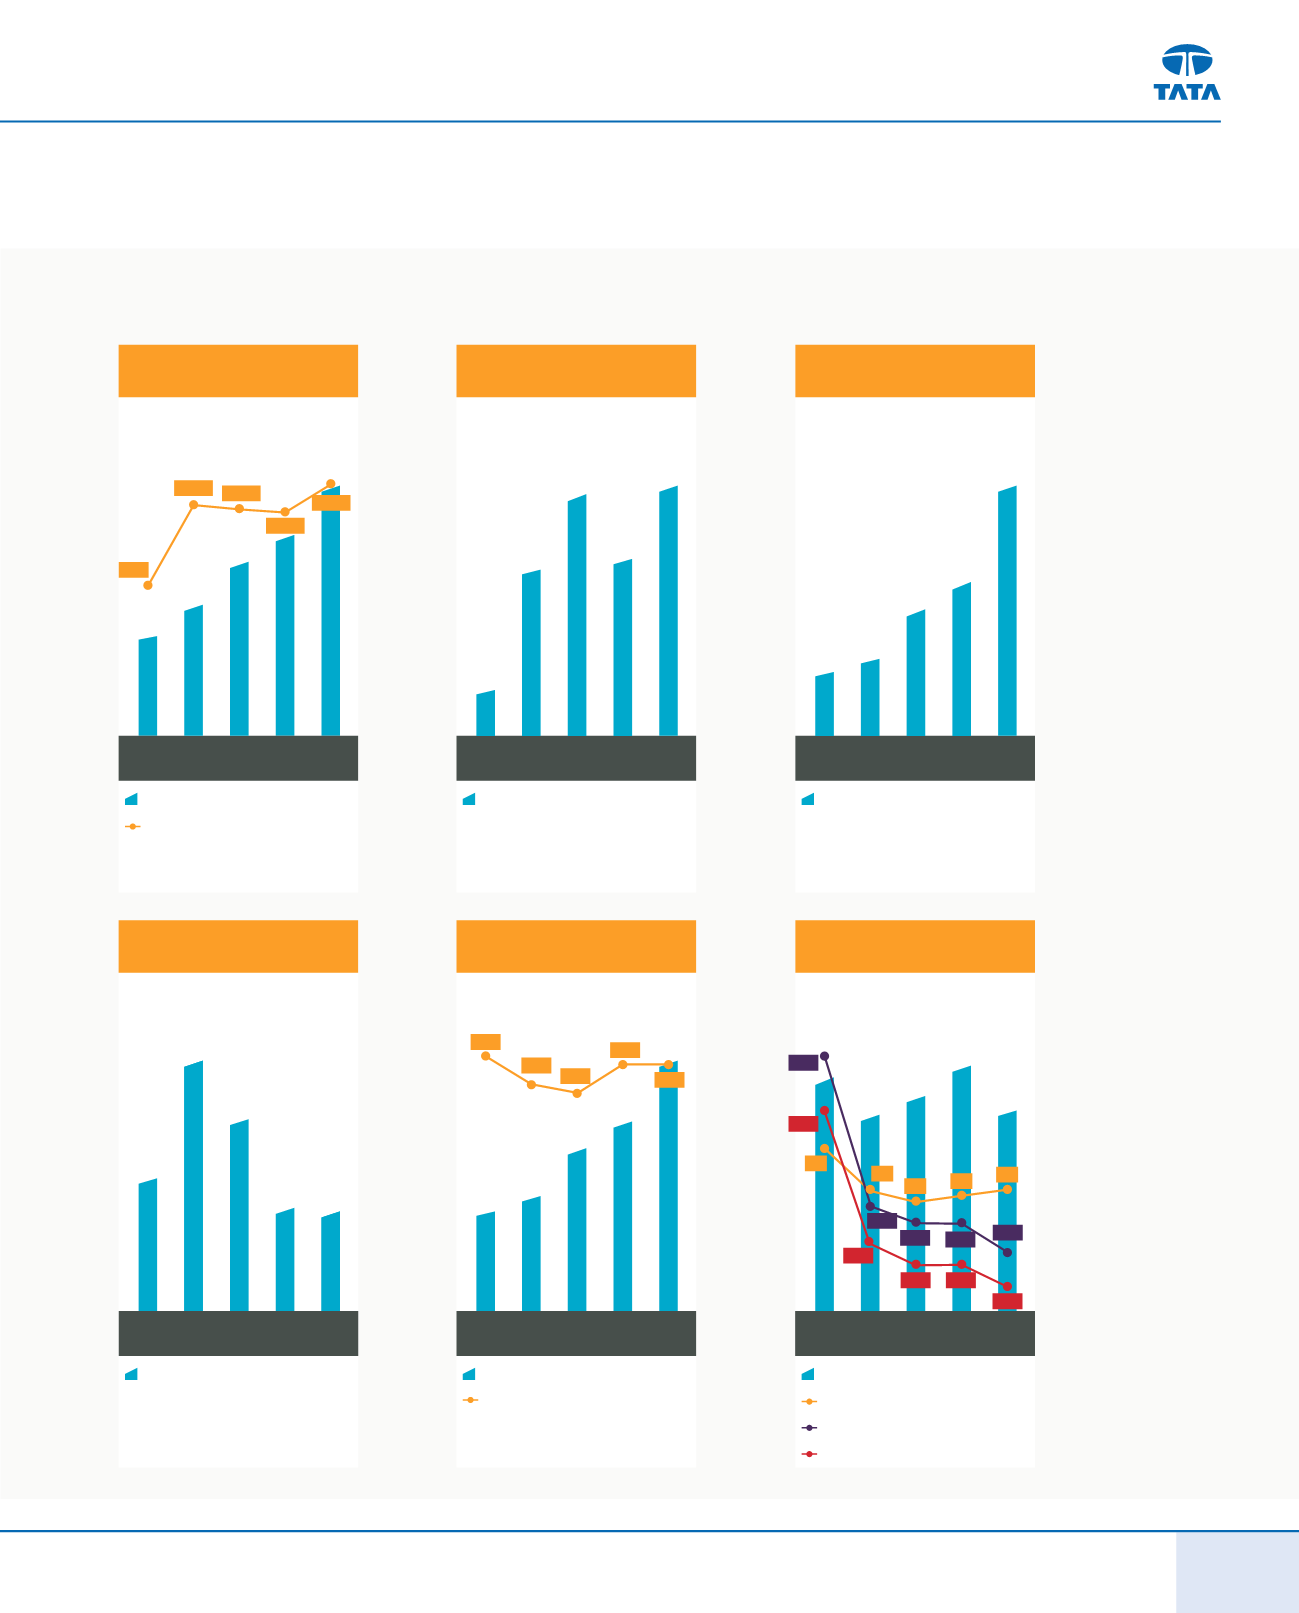
NET CASH FROM
OPERATIONS (
`
crores)
Net Cash from
Operations
2010 2011 2012 2013 2014
18,384
22,163
36,151
11,240
9,327
PROFIT (
`
crores)
Profit for the year
2010 2011 2012 2013 2014
13,517
9,893
13,991
9,274
2,571
RETURN ON EQUITY %
Return on Equity
2010 2011 2012 2013 2014
52
28
27
68
36
TOTAL REVENUE (
`
crores)
EBITDA MARGIN %
Net Revenue,
EBITDA Margin
2010 2011 2012 2013 2014
165,654
188,793
232,834
232,834
122,128
91,810
9.38
14.56 14.31
14.10
16.06
TOTAL ASSETS (
`
crores)
TOTAL ASSETS TURNOVER (times)
Total Assets & Assets
Turnover Ratio
2010 2011 2012 2013 2014
144,931
170,378
232,834
219,998
101,014
86,726
0.87
0.77
0.74
0.84
0.84
BORROWINGS (NET) (
`
crores)
INTEREST AS A % OF TOTAL INCOME
DEBT EQUITY RATIO
DEBT (NET OF SURPLUS CASH) EQUITY RATIO
Borrowings (Net of surplus
cash) & Interest as%of Sales
2010 2011 2012 2013 2014
23,636
26,972
22,043
21,578
27,514
4.28
3.35
2.7
2.0
1.8 1.9 2.0
1.13
0.72 0.72
0.34
1.71
1.44 1.43 0.92
(TATA MOTORS GROUP)


