33
Awards and Accolades
(32-35)
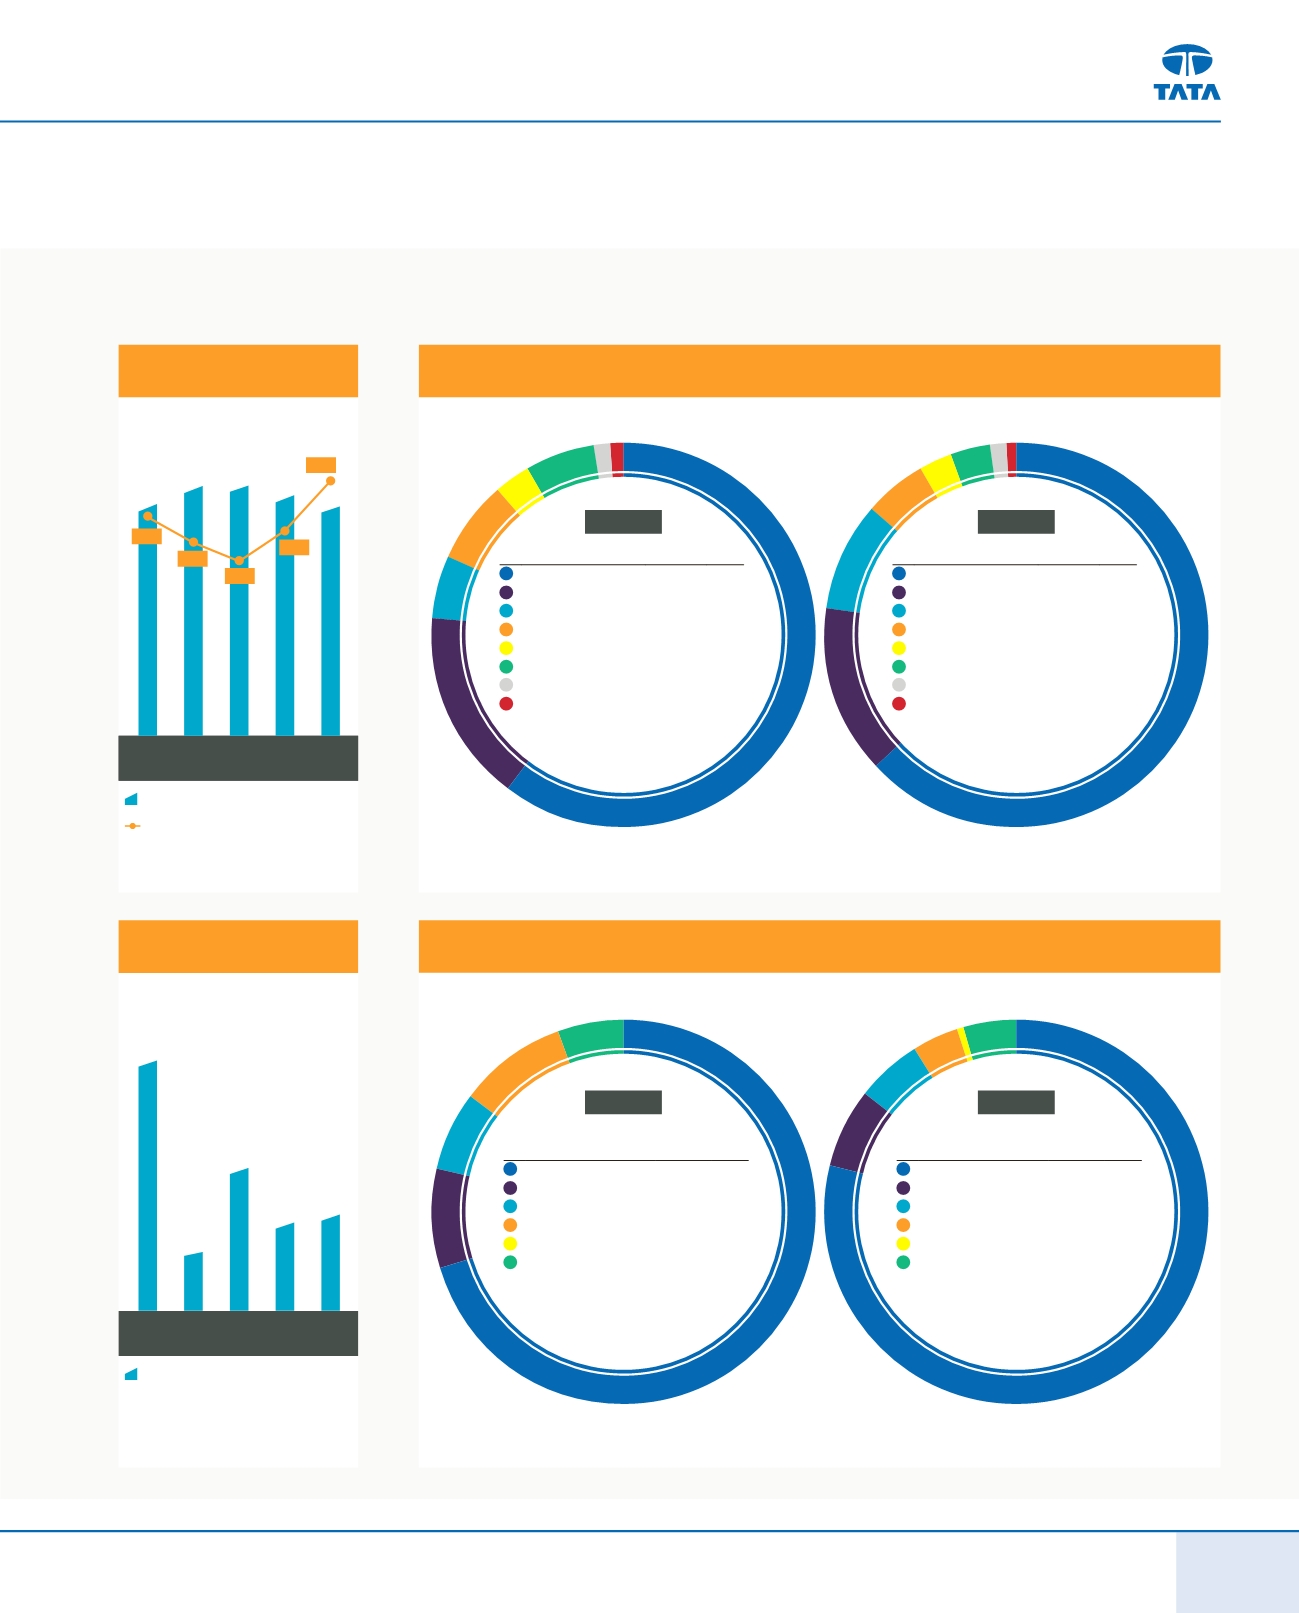
Financial Performance
Summarised Balance Sheet and Statement of Profit and Loss (Consolidated)
`
crores
%
Materials
25,914.40
62.3
Operations & Other Exp.
6,847.35
16.5
Taxes and Duties
2,302.64
5.5
Employees
2,877.69
6.9
Interest
1,337.52
3.2
Depreciation
2,070.30
5.0
Shareholders
651.90
1.6
Reserves
(410.77)
-1.0
Total
41,591.03
100
Distribution of Revenue
`
crores
%
Materials
32,965.13
64.1
Operations & Other Exp 7,500.54
14.6
Taxes And Duties
4,677.10
9.1
Employees
2,837.00
5.5
Interest
1,387.76
2.7
Depreciation
1,817.62
3.5
Shareholders
645.20
1.3
Reserves
(422.42)
-0.8
Total
51,407.93
100
TOTAL ASSETS (
`
crores)
TOTAL ASSETS TURNOVER (times)
Total Assets & Asset
Turnover Ratio
2010 2011 2012 2013 2014
54,261
52,185
49,734
54,190
50,280
1.16
1.02
0.92
1.08
1.35
2013-14
2012-13
`
crores
%
Domestic Vehicle Sale 29,256.57
70.3
Exports
3,508.26
8.4
Domestic Spare Part Sales 2,760.69
6.6
Dividend/Other Income 3,833.03
9.2
Vehicle Financing
18.22
0.0
Others
2,214.26
5.3
Total
41,591.03
100
`
crores
%
Domestic Vehicle Sale 40,781.40
79.3
Exports
3,419.50
6.7
Domestic Spare Part Sales 2,883.53
5.6
Dividend/Other Income 2,088.20
4.1
Vehicle Financing
39.48
0.1
Others
2,195.82
4.3
Total
51,407.93
100
Sources of Revenue
Net Cash from
Operations
NET CASH FROM OPERATIONS
(
`
crores)
2010 2011 2012 2013 2014
3,654
2,258
2,463
1,506
6,400
2013-14
2012-13


