Statutory Reports
Corporate Overview
69th Annual Report 2013-14
32
Financial Statements
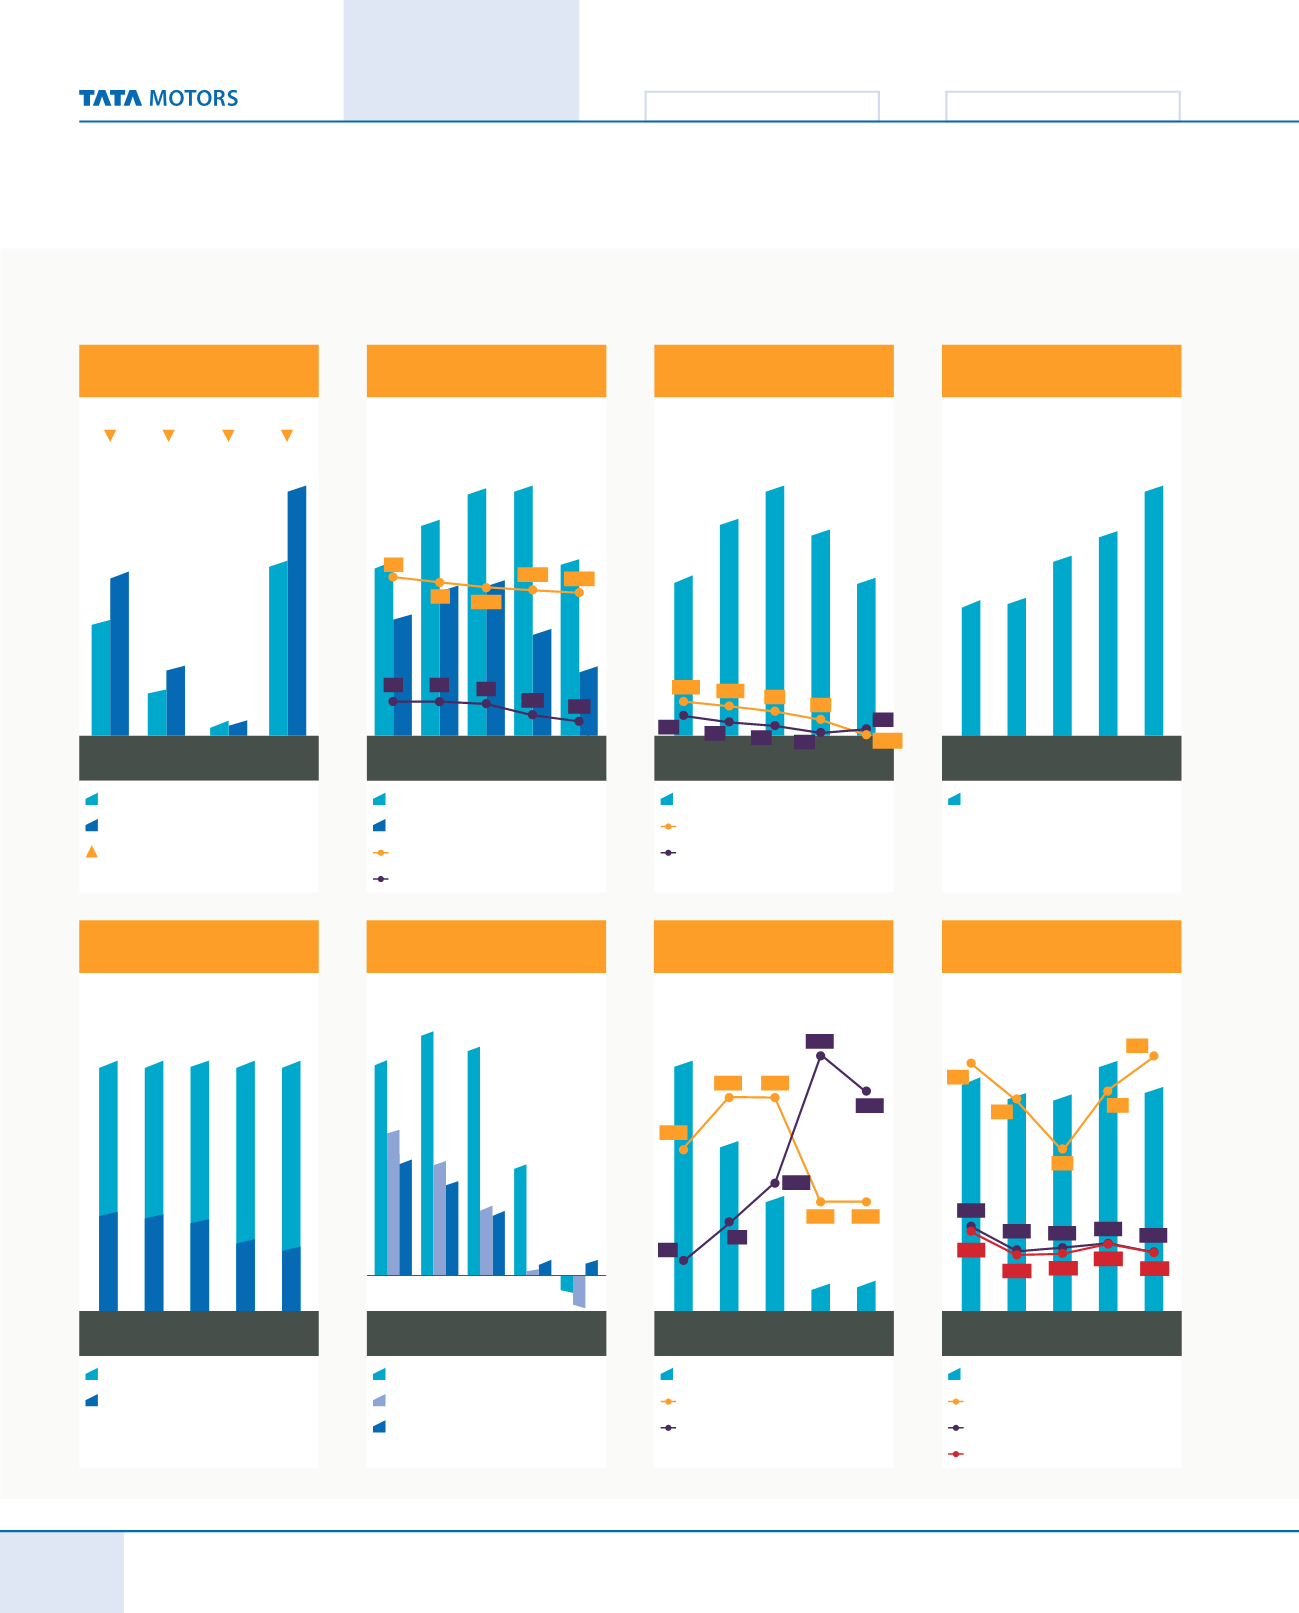
FINANCIAL
PERFORMANCE
CV
Domestic
PV
Domestic
Export
2014 (in thousands)
2013 (in thousands)
GROWTH
142
570
816
50
51
229
536
-29.5% -38.1% -2.0% -30.2%
378
Total
CV VOLUMES (in thousands)
PV VOLUMES (in thousands)
CV MARKET SHARE (%)
PC MARKET SHARE (%)
Vehicle Sales (Domestic)
and Market Share
2010 2011 2012 2013 2014
530
333
536
229
378
142
459
320
260
374
64
14 14
62 59.8
59.6 54.1
R&D EXPENDITURE (
`
crores)
R&D Expenditure
2010 2011 2012 2013 2014
1,549
1,759
2,144
1,187
1,167
NET INCOME* (
`
crores)
EBITDA MARGIN (%)
PAT AS A % OF TURNOVER
* Excludes Other Income
Net Income, EBITDA
Margin, Net Margin
2010 2011 2012 2013 2014
54,307
44,766
34,288
47,088
34,835
Volume Growth
13
9.0 5.8
12.0 10.2 8.1 4.8
1.0
0.7
2.3
(1.4)
3.8
6.4
CV (%)
PV (%)
60
Product Mix (Volumes)
2010 2011 2012 2013 2014
74
26
71
29
63
37
61
39
40
EBITDA (
`
crores)
PBT (
`
crores)
PAT (
`
crores)
2010 2011 2012 2013 2014
4,412
2,144
1,242
302
(482)
335
4,806
1,812
2,240
2,830
175
(1,026)
1,341
2,197
4,178
EPS (
`
)
DIVIDEND %
DIVIDEND PAYOUT AS % TO PAT
Dividend & EPS
2010 2011 2012 2013 2014
3.90
0.93
1.03
6.06
8.47
BORROWINGS (NET ) (
`
crores)
INTEREST AS A % OF TOTAL INCOME
DEBT EQUITY RATIO
DEBT (NET OF SURPLUS CASH) EQUITY RATIO
Borrowings (Net of surplus
cash) & Interest as%of Sales
2010 2011 2012 2013 2014
14,361
16,593
14,854
14,440
15,488
Profits
(EBITDA, PBT, PAT)
150
200 200
100
3.4
2.9
2.2
3.0
3.5
100
222
1.12
0.79 0.82
1.05
0.72 0.74
0.85
0.77
240
118
81
44
0.88 0.78
(COMPANY STANDALONE)


