Statutory Reports
Corporate Overview
69th Annual Report 2013-14
202
Financial Statements
(Consolidated)
(a)
Defined contribution plans-
The Company’s contribution to defined contribution plan aggregated
`
271.62
crores
(2012-13
`
235.60 crores) for the year ended March 31, 2014 has been recognised in the Statement of Profit
and Loss in note 25 on page 196.
(b) The expected rate of return on plan assets is based on market expectation, at the beginning of the year, for returns over the entire life of the related obligation.
(c)
The assumption of future salary increases, considered in actuarial valuation, take account of inflation, seniority, promotion and other relevant factors, such as supply and demand in the employment
market.
(d) The Company expects to contribute
`
102.77
crores
to the funded pension plans in the year 2014-2015.
NOTES FORMING PART OF CONSOLIDATED FINANCIAL STATEMENTS
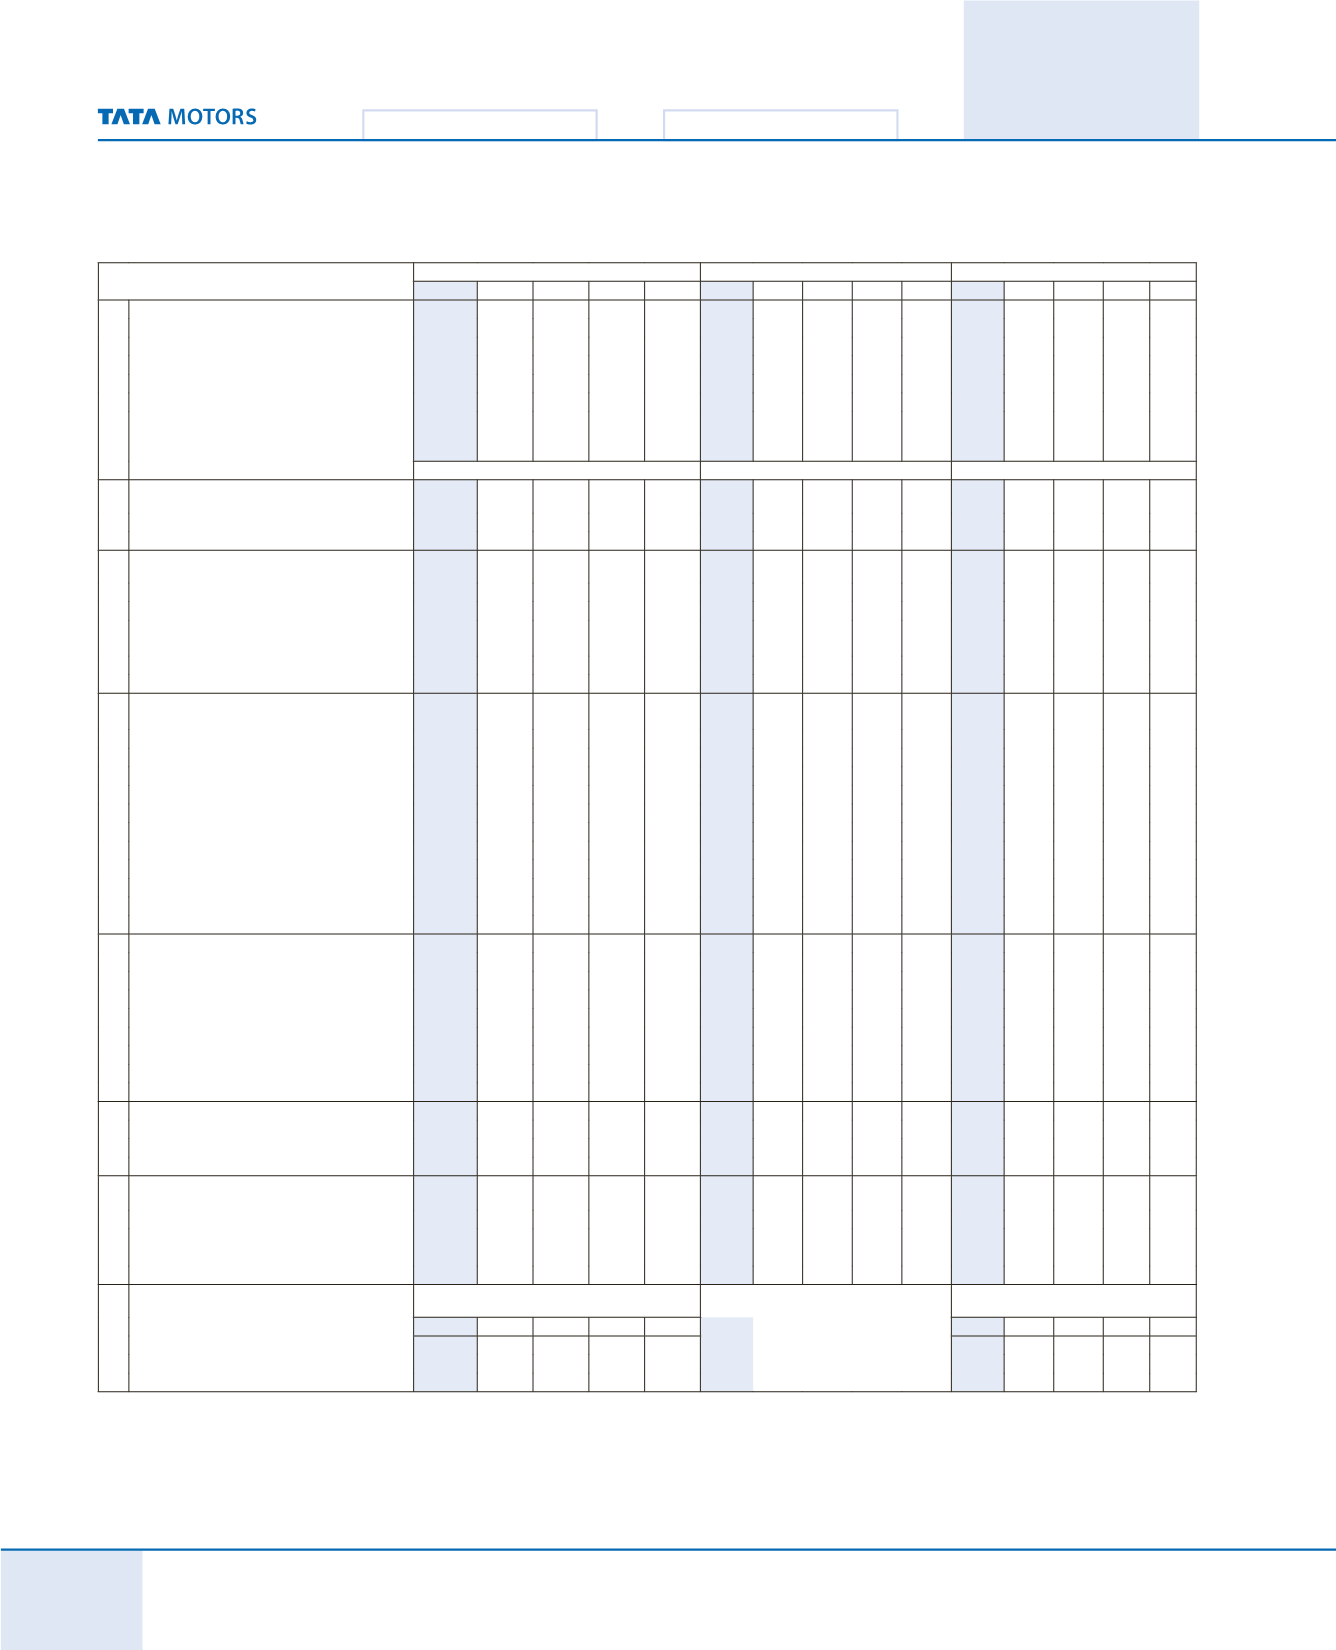
33. (a) Defined benefit plans / Long term compensated absences
(
`
in crores)
As at / for the year ended on March 31,
Gratuity, Superannuation and BKY / PSY
Compensated Absences
Post-retirement Medicare scheme
2014
2013 2012 2011 2010
2014
2013 2012 2011 2010
2014
2013 2012 2011 2010
(i) Components of employer expense
Current service cost
58.53
52.66 46.97 35.98 31.78
38.30
34.43 27.95
22.29
18.66
5.18
4.06
4.22
3.67
3.27
Interest cost
63.81
60.09 55.48 48.11 45.09
21.75
20.59
17.83
14.07
12.16
9.06
8.34
8.14
7.23
7.05
Expected return on plan assets
(57.02)
(53.64)
(49.95)
(44.86)
(42.32)
-
-
-
-
-
-
-
-
-
-
Past service cost
-
-
-
0.07
0.57
-
-
-
-
-
0.55
-
-
-
-
Actuarial losses / (gains)
(0.19)
5.00 21.96 60.26 50.92
(25.53)
6.07
23.23
40.45
29.16
2.65
2.00
(6.02)
3.80 (0.14)
Total expense recognised in the Statement of
Profit and Loss in note 25, page 196 :
65.13
64.11 74.46 99.56 86.04
34.52
61.09
69.01
76.81
59.98
17.44
14.40
6.34 14.70 10.18
(b) & (c)
(a)
(c)
(ii) Actual contribution and benefit
payments
Actual benefit payments
85.85
81.62 56.42 64.62 64.08
49.22
41.29
32.26
33.00
23.60
3.90
4.07
3.90
4.13
4.38
Actual contributions
42.38
67.98 68.34 85.05 86.98
49.22
41.29
32.26
33.00
23.60
3.90
4.07
3.90
4.13
4.38
(iii) Net asset / (liability) recognised in
Balance Sheet
Present value of Defined Benefit Obligation
826.27
813.35 756.58 691.32 608.93
267.06
282.53 262.73 225.76 181.95
124.05
110.51 100.18 97.74 87.17
Fair value of plan assets
720.63
737.38 676.74 618.02 550.07
-
-
-
-
-
-
-
-
-
-
Net asset / (liability) recognised in
Balance Sheet
(105.64)
(75.97)
(79.84)
(73.30)
(58.86)
(267.06)
(282.53)
(262.73)
(225.76)
(181.95)
(124.05)
(110.51)
(100.18) (97.74) (87.17)
Experience adjustment on plan liabilities
23.55
(23.57)
(7.35)
(36.91)
(4.29)
N/A
N/A
N/A
N/A
N/A
3.46
8.76
(2.83)
5.32
0.39
Experience adjustment on plan assets
23.38
20.94
(3.16)
2.72
(5.11)
N/A
N/A
N/A
N/A
N/A
-
-
-
-
-
(iv) Change in Defined Benefit Obligations (DBO)
Present value of DBO at beginning of year
813.35
756.58 691.32 608.93 575.75
282.53
262.73 225.76 181.95 154.81
110.51
100.18
97.74 87.17 85.18
Liability on acquisitions
-
0.04
0.43
-
-
-
-
0.22
-
-
-
-
-
-
-
Current service cost
58.53
52.66 46.97 35.98 31.78
38.30
34.43
27.95
22.29
18.66
5.18
4.06
4.22
3.67
3.27
Past service cost
-
-
-
-
-
-
-
-
-
-
0.55
-
-
-
-
Interest cost
63.81
60.09 55.48 48.11 45.09
21.75
20.59
17.83
14.07
12.16
9.06
8.34
8.14
7.23
7.05
Plan amendments
-
-
-
-
0.65
-
-
-
-
-
-
-
-
-
-
Settlement cost / (credit)
-
-
-
-
-
(0.77)
-
-
-
-
-
-
-
-
-
Actuarial (gains) / losses
(23.57)
25.60
18.80
62.92
46.17
(25.53)
6.07
23.23
40.45
29.16
2.65
2.00
(6.02)
3.80 (0.14)
Benefits paid
(85.85)
(81.62)
(56.42)
(64.62)
(64.08)
(49.22)
(41.29) (32.26) (33.00) (23.60)
(3.90)
(4.07)
(3.90) (4.13) (4.38)
Sale of stake in subsidiary
-
-
-
-
(26.43)
-
-
-
-
(9.24)
-
-
-
- (3.81)
Present value of DBO at the end of year
826.27
813.35 756.58 691.32 608.93
267.06
282.53 262.73 225.76 181.95
124.05
110.51 100.18 97.74 87.17
(v) Change in fair value of assets
Plan assets at beginning of year
737.38
676.74 618.02 550.07 517.28
-
-
-
-
-
-
-
-
-
-
Liability on acquisitions
-
0.04
-
-
-
-
-
-
-
-
-
-
-
-
-
Actual return on plan assets
33.65
74.24 46.80 47.52 37.57
-
-
-
-
-
-
-
-
-
-
Actual Company contributions
42.38
67.98 68.34 85.05 86.98
49.22
41.29
32.26
33.00
23.60
3.90
4.07
3.90
4.13
4.38
Benefits paid
(85.85)
(81.62)
(56.42)
(64.62)
(64.08)
(49.22)
(41.29) (32.26) (33.00) (23.60)
(3.90)
(4.07)
(3.90) (4.13) (4.38)
Sale of stake in subsidiary
-
-
-
-
(27.68)
-
-
-
-
-
-
-
-
-
-
Others
(6.93)
-
-
-
-
-
-
-
-
-
-
-
-
-
-
Plan assets at the end of year
720.63
737.38 676.74 618.02 550.07
-
-
-
-
-
-
-
-
-
-
(vi) Actuarial assumptions
Discount rate (%)
6.75-9.30
6.75-8.35 6.75-8.90 6.75-8.50 6.75-8.70
9.20
8.35
8.50
8.50
8.50
9.20
8.35
8.50
8.50
8.50
Expected return on plan assets (%)
8.00-9.25
8.00-9.25 8.00-9.25 8.00-9.25 8.00-9.25
N/A
N/A
N/A
N/A
N/A
N/A
N/A
N/A
N/A
N/A
Medical cost inflation (%)
N/A
N/A
N/A
N/A
N/A
N/A
N/A
N/A
N/A
N/A
6.00
5.00
4.00
4.00
4.00
(vii) The major categories of plan assets as
percentage to total plan assets
Debt securities
71%
73% 77% 75% 76%
N/A
N/A
N/A
N/A
N/A
N/A
N/A
N/A
N/A
N/A
Balance with approved insurance companies
28%
24% 19%
-
-
N/A
N/A
N/A
N/A
N/A
N/A
N/A
N/A
N/A
N/A
Balances with banks
1%
4% 4% 25% 24%
N/A
N/A
N/A
N/A
N/A
N/A
N/A
N/A
N/A
N/A
(viii) Effect of one percentage point change in
assumed medical inflation rate
One percentage point increase in
medical inflation rate
One percentage point decrease in
medical inflation rate
2014
2013 2012 2011 2010
2014
2013 2012 2011 2010
Revised DBO
137.03
121.00
108.44
104.57
100.15
111.55
101.33
81.62 88.49 82.98
Revised service cost
6.05
4.86
4.88
4.30
3.78
4.47
3.41
3.04
3.16
2.80
Revised interest cost
9.94
9.30
8.85
7.97
7.78
8.30
7.54
6.81
6.59
6.42


